|
Download Data (XLS File) |
|
||||||||
|
||||||||
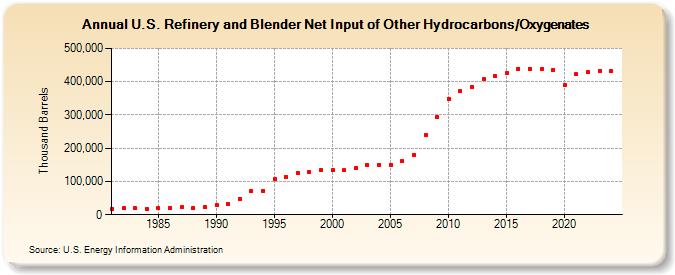
| U.S. Refinery and Blender Net Input of Other Hydrocarbons/Oxygenates (Thousand Barrels) | ||||||||
| Decade | Year-0 | Year-1 | Year-2 | Year-3 | Year-4 | Year-5 | Year-6 | Year-7 | Year-8 | Year-9 |
|---|---|---|---|---|---|---|---|---|---|---|
| 1980's | 18,431 | 19,126 | 19,283 | 16,572 | 20,012 | 21,097 | 23,304 | 19,515 | 21,757 | |
| 1990's | 28,642 | 31,574 | 47,918 | 70,153 | 72,605 | 107,241 | 114,720 | 125,265 | 127,881 | 134,113 |
| 2000's | 134,049 | 133,492 | 140,844 | 149,342 | 150,674 | 150,284 | 161,993 | 179,942 | 239,259 | 293,844 |
| 2010's | 348,909 | 370,755 | 384,364 | 407,047 | 415,705 | 425,907 | 438,972 | 439,078 | 438,333 | 436,068 |
| 2020's | 389,633 | 421,686 | 428,076 | 431,052 |
| - = No Data Reported; -- = Not Applicable; NA = Not Available; W = Withheld to avoid disclosure of individual company data. |
| Release Date: 3/29/2024 |
| Next Release Date: 8/30/2024 |