|
Download Data (XLS File) |
|
||||||||
|
||||||||
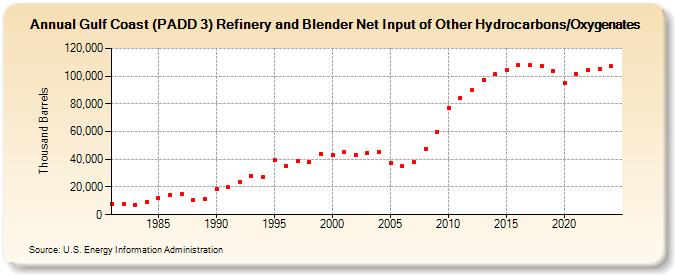
| Gulf Coast (PADD 3) Refinery and Blender Net Input of Other Hydrocarbons/Oxygenates (Thousand Barrels) | ||||||||
| Decade | Year-0 | Year-1 | Year-2 | Year-3 | Year-4 | Year-5 | Year-6 | Year-7 | Year-8 | Year-9 |
|---|---|---|---|---|---|---|---|---|---|---|
| 1980's | 7,963 | 7,640 | 7,266 | 9,088 | 12,018 | 14,099 | 14,981 | 10,783 | 11,624 | |
| 1990's | 18,627 | 19,657 | 23,655 | 28,220 | 27,431 | 39,539 | 35,357 | 38,986 | 38,345 | 43,640 |
| 2000's | 43,232 | 45,102 | 43,419 | 44,381 | 45,346 | 37,362 | 34,926 | 38,088 | 47,595 | 59,909 |
| 2010's | 76,977 | 84,254 | 89,978 | 97,406 | 101,485 | 104,257 | 107,768 | 108,184 | 107,416 | 103,712 |
| 2020's | 94,833 | 101,417 | 104,696 | 105,346 |
| - = No Data Reported; -- = Not Applicable; NA = Not Available; W = Withheld to avoid disclosure of individual company data. |
| Release Date: 3/29/2024 |
| Next Release Date: 8/30/2024 |