|
Download Data (XLS File) |
|
||||||||
|
||||||||
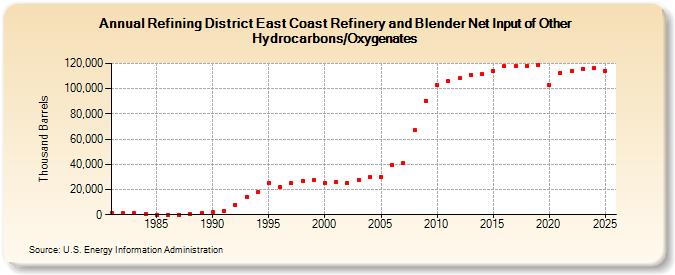
| Refining District East Coast Refinery and Blender Net Input of Other Hydrocarbons/Oxygenates (Thousand Barrels) | ||||||||
| Decade | Year-0 | Year-1 | Year-2 | Year-3 | Year-4 | Year-5 | Year-6 | Year-7 | Year-8 | Year-9 |
|---|---|---|---|---|---|---|---|---|---|---|
| 1980's | 1,107 | 1,127 | 1,070 | 750 | 25 | 65 | 96 | 412 | 1,479 | |
| 1990's | 2,035 | 2,842 | 7,969 | 13,958 | 17,665 | 25,016 | 22,213 | 24,838 | 27,095 | 27,680 |
| 2000's | 25,527 | 25,985 | 25,271 | 27,606 | 29,921 | 29,966 | 39,338 | 41,303 | 66,868 | 90,515 |
| 2010's | 102,769 | 105,827 | 108,233 | 111,084 | 111,476 | 114,292 | 117,672 | 117,775 | 118,077 | 118,535 |
| 2020's | 102,565 | 112,645 | 114,193 | 115,711 |
| - = No Data Reported; -- = Not Applicable; NA = Not Available; W = Withheld to avoid disclosure of individual company data. |
| Release Date: 8/30/2024 |
| Next Release Date: 8/29/2025 |