|
Download Data (XLS File) |
|
||||||||
|
||||||||
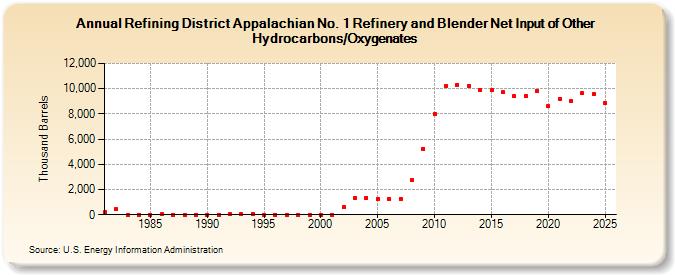
| Refining District Appalachian No. 1 Refinery and Blender Net Input of Other Hydrocarbons/Oxygenates (Thousand Barrels) | ||||||||
| Decade | Year-0 | Year-1 | Year-2 | Year-3 | Year-4 | Year-5 | Year-6 | Year-7 | Year-8 | Year-9 |
|---|---|---|---|---|---|---|---|---|---|---|
| 1980's | 186 | 434 | 0 | 0 | 0 | 38 | 0 | 0 | 0 | |
| 1990's | 9 | 13 | 29 | 31 | 79 | 17 | 4 | 8 | 5 | 6 |
| 2000's | 4 | 0 | 581 | 1,359 | 1,352 | 1,285 | 1,254 | 1,281 | 2,749 | 5,241 |
| 2010's | 7,998 | 10,247 | 10,325 | 10,209 | 9,898 | 9,862 | 9,714 | 9,397 | 9,452 | 9,842 |
| 2020's | 8,614 | 9,217 | 9,019 | 9,502 |
| - = No Data Reported; -- = Not Applicable; NA = Not Available; W = Withheld to avoid disclosure of individual company data. |
| Release Date: 6/28/2024 |
| Next Release Date: 8/30/2024 |