|
Download Data (XLS File) |
|
||||||||
|
||||||||
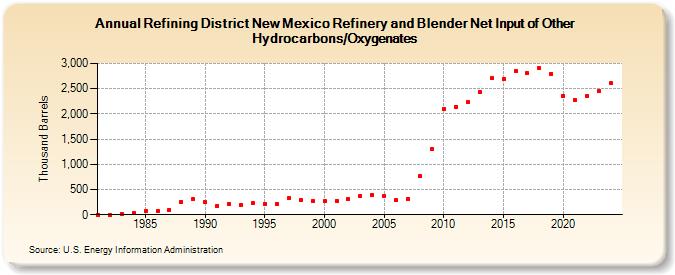
| Refining District New Mexico Refinery and Blender Net Input of Other Hydrocarbons/Oxygenates (Thousand Barrels) | ||||||||
| Decade | Year-0 | Year-1 | Year-2 | Year-3 | Year-4 | Year-5 | Year-6 | Year-7 | Year-8 | Year-9 |
|---|---|---|---|---|---|---|---|---|---|---|
| 1980's | 1 | 0 | 24 | 38 | 73 | 75 | 98 | 254 | 302 | |
| 1990's | 244 | 180 | 222 | 197 | 230 | 217 | 215 | 330 | 293 | 276 |
| 2000's | 272 | 280 | 306 | 368 | 392 | 369 | 282 | 314 | 761 | 1,313 |
| 2010's | 2,097 | 2,146 | 2,229 | 2,435 | 2,703 | 2,697 | 2,841 | 2,811 | 2,901 | 2,798 |
| 2020's | 2,361 | 2,273 | 2,357 | 2,431 |
| - = No Data Reported; -- = Not Applicable; NA = Not Available; W = Withheld to avoid disclosure of individual company data. |
| Release Date: 3/29/2024 |
| Next Release Date: 8/30/2024 |