|
Download Data (XLS File) |
|
||||||||
|
||||||||
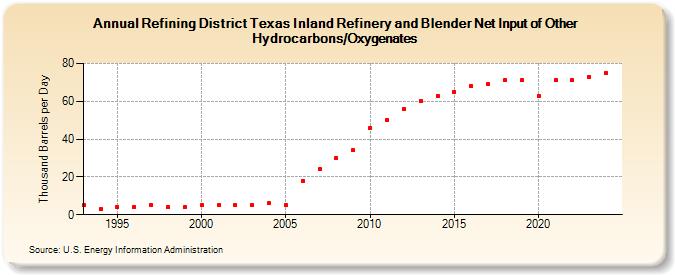
| Refining District Texas Inland Refinery and Blender Net Input of Other Hydrocarbons/Oxygenates (Thousand Barrels per Day) | ||||||||
| Decade | Year-0 | Year-1 | Year-2 | Year-3 | Year-4 | Year-5 | Year-6 | Year-7 | Year-8 | Year-9 |
|---|---|---|---|---|---|---|---|---|---|---|
| 1990's | 5 | 3 | 4 | 4 | 5 | 4 | 4 | |||
| 2000's | 5 | 5 | 5 | 5 | 6 | 5 | 18 | 24 | 30 | 34 |
| 2010's | 46 | 50 | 56 | 60 | 63 | 65 | 68 | 69 | 71 | 71 |
| 2020's | 63 | 71 | 71 | 73 |
| - = No Data Reported; -- = Not Applicable; NA = Not Available; W = Withheld to avoid disclosure of individual company data. |
| Release Date: 3/29/2024 |
| Next Release Date: 8/30/2024 |