|
Download Data (XLS File) |
|
||||||||
|
||||||||
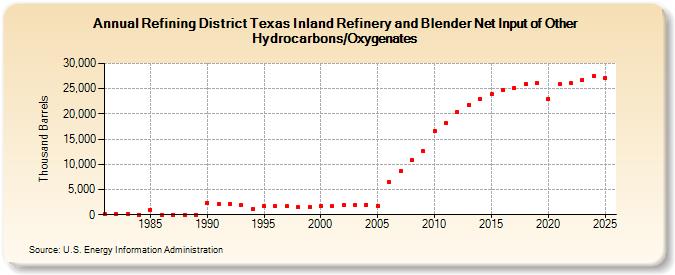
| Refining District Texas Inland Refinery and Blender Net Input of Other Hydrocarbons/Oxygenates (Thousand Barrels) | ||||||||
| Decade | Year-0 | Year-1 | Year-2 | Year-3 | Year-4 | Year-5 | Year-6 | Year-7 | Year-8 | Year-9 |
|---|---|---|---|---|---|---|---|---|---|---|
| 1980's | 94 | 171 | 158 | 28 | 1,022 | 0 | 0 | 1 | 0 | |
| 1990's | 2,360 | 2,143 | 2,199 | 1,847 | 1,126 | 1,632 | 1,644 | 1,644 | 1,478 | 1,569 |
| 2000's | 1,758 | 1,675 | 1,839 | 1,963 | 2,020 | 1,793 | 6,398 | 8,581 | 10,845 | 12,589 |
| 2010's | 16,646 | 18,192 | 20,333 | 21,847 | 22,926 | 23,855 | 24,707 | 25,137 | 25,925 | 26,085 |
| 2020's | 23,028 | 25,872 | 26,077 | 26,795 |
| - = No Data Reported; -- = Not Applicable; NA = Not Available; W = Withheld to avoid disclosure of individual company data. |
| Release Date: 6/28/2024 |
| Next Release Date: 8/30/2024 |