|
Download Data (XLS File) |
|
||||||||
|
||||||||
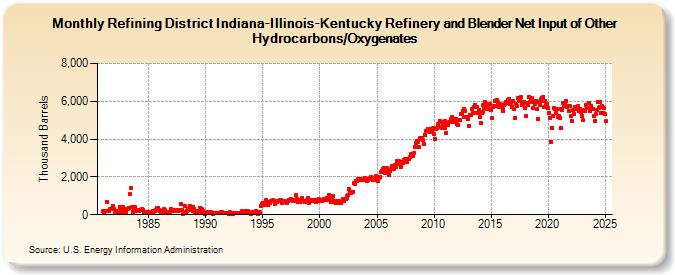
| Refining District Indiana-Illinois-Kentucky Refinery and Blender Net Input of Other Hydrocarbons/Oxygenates (Thousand Barrels) | ||||||||
| Year | Jan | Feb | Mar | Apr | May | Jun | Jul | Aug | Sep | Oct | Nov | Dec |
|---|---|---|---|---|---|---|---|---|---|---|---|---|
| 1981 | 182 | 160 | 209 | 188 | 677 | 197 | 191 | 293 | 300 | 287 | 478 | 286 |
| 1982 | 118 | 183 | 200 | 164 | 147 | 208 | 416 | 133 | 350 | 382 | 110 | 180 |
| 1983 | 137 | 322 | 318 | 379 | 1,074 | 1,396 | 399 | 170 | 371 | 371 | 389 | 266 |
| 1984 | 202 | 256 | 191 | 230 | 225 | 328 | 271 | 133 | 131 | 114 | 114 | 148 |
| 1985 | 130 | 107 | 100 | 129 | 164 | 180 | 182 | 171 | 245 | 358 | 375 | 265 |
| 1986 | 180 | 157 | 175 | 147 | 297 | 242 | 157 | 148 | 125 | 149 | 134 | 306 |
| 1987 | 241 | 261 | 178 | 211 | 210 | 224 | 254 | 212 | 235 | 256 | 572 | 266 |
| 1988 | 50 | 87 | 486 | 156 | 209 | 279 | 268 | 482 | 398 | 259 | 216 | 434 |
| 1989 | 297 | 80 | 118 | 94 | 171 | 183 | 360 | 158 | 300 | 184 | 136 | 63 |
| 1990 | 107 | 84 | 136 | 139 | 96 | 127 | 85 | 103 | 51 | 84 | 97 | 89 |
| 1991 | 117 | 84 | 109 | 114 | 141 | 120 | 102 | 90 | 68 | 88 | 73 | 92 |
| 1992 | 60 | 63 | 130 | 61 | 34 | 63 | 66 | 85 | 114 | 75 | 101 | 87 |
| 1993 | 80 | 112 | 183 | 143 | 127 | 161 | 192 | 133 | 206 | 74 | 159 | 131 |
| 1994 | 51 | 100 | 148 | 130 | 143 | 196 | 131 | 55 | 69 | 150 | 447 | 574 |
| 1995 | 616 | 503 | 538 | 752 | 576 | 488 | 618 | 676 | 640 | 706 | 731 | 753 |
| 1996 | 744 | 586 | 702 | 669 | 728 | 716 | 752 | 772 | 626 | 716 | 700 | 685 |
| 1997 | 698 | 637 | 715 | 755 | 792 | 790 | 808 | 763 | 747 | 755 | 746 | 1,023 |
| 1998 | 848 | 660 | 669 | 654 | 804 | 865 | 750 | 747 | 673 | 697 | 785 | 886 |
| 1999 | 715 | 638 | 716 | 763 | 702 | 745 | 768 | 776 | 698 | 777 | 745 | 808 |
| 2000 | 746 | 723 | 724 | 761 | 810 | 849 | 774 | 891 | 788 | 810 | 1,020 | 838 |
| 2001 | 688 | 768 | 999 | 696 | 702 | 626 | 713 | 747 | 634 | 696 | 633 | 738 |
| 2002 | 805 | 705 | 823 | 837 | 897 | 985 | 1,032 | 1,346 | 1,186 | 1,164 | 1,180 | 1,217 |
| 2003 | 1,677 | 1,608 | 1,801 | 1,798 | 1,865 | 1,829 | 1,894 | 1,879 | 1,820 | 1,842 | 1,828 | 1,916 |
| 2004 | 1,821 | 1,762 | 1,901 | 1,850 | 1,913 | 1,917 | 1,976 | 1,934 | 1,842 | 1,902 | 1,906 | 2,039 |
| 2005 | 1,851 | 1,782 | 1,959 | 2,000 | 2,271 | 2,314 | 2,395 | 2,460 | 2,225 | 2,363 | 2,312 | 2,464 |
| 2006 | 2,237 | 2,082 | 2,338 | 2,396 | 2,563 | 2,497 | 2,416 | 2,606 | 2,530 | 2,851 | 2,667 | 2,832 |
| 2007 | 2,733 | 2,504 | 2,771 | 2,739 | 2,877 | 2,865 | 2,940 | 2,954 | 2,786 | 2,960 | 2,938 | 3,064 |
| 2008 | 3,190 | 3,138 | 3,126 | 3,272 | 3,574 | 3,775 | 3,881 | 3,826 | 3,608 | 4,064 | 4,007 | 4,039 |
| 2009 | 3,937 | 3,763 | 4,205 | 4,220 | 4,417 | 4,435 | 4,521 | 4,535 | 4,378 | 4,475 | 4,435 | 4,587 |
| 2010 | 4,270 | 4,020 | 4,539 | 4,562 | 4,779 | 4,647 | 4,982 | 4,926 | 4,600 | 4,803 | 4,727 | 4,933 |
| 2011 | 4,611 | 4,319 | 4,838 | 4,738 | 4,914 | 4,890 | 5,060 | 5,191 | 4,909 | 5,058 | 4,892 | 5,080 |
| 2012 | 4,795 | 4,727 | 5,018 | 5,004 | 5,350 | 5,342 | 5,470 | 5,569 | 5,166 | 5,508 | 5,158 | 5,178 |
| 2013 | 5,078 | 4,718 | 5,274 | 5,259 | 5,593 | 5,397 | 5,679 | 5,811 | 5,369 | 5,676 | 5,402 | 5,548 |
| 2014 | 5,173 | 4,863 | 5,383 | 5,448 | 5,820 | 5,645 | 5,951 | 5,879 | 5,597 | 5,752 | 5,593 | 5,882 |
| 2015 | 5,530 | 5,091 | 5,705 | 5,734 | 6,004 | 5,777 | 6,087 | 5,946 | 5,676 | 5,832 | 5,698 | 5,787 |
| 2016 | 5,577 | 5,490 | 5,826 | 5,842 | 5,987 | 5,922 | 6,048 | 6,147 | 5,875 | 5,922 | 5,702 | 5,999 |
| 2017 | 5,605 | 5,137 | 5,881 | 5,771 | 6,174 | 6,071 | 6,001 | 6,252 | 5,817 | 5,978 | 5,833 | 5,939 |
| 2018 | 5,619 | 5,216 | 5,920 | 5,794 | 6,243 | 5,982 | 6,050 | 6,180 | 5,629 | 5,970 | 5,857 | 6,005 |
| 2019 | 5,576 | 5,074 | 5,949 | 5,802 | 6,100 | 5,989 | 6,178 | 6,246 | 5,687 | 6,010 | 5,809 | 5,860 |
| 2020 | 5,654 | 5,395 | 5,105 | 3,868 | 4,602 | 5,210 | 5,628 | 5,600 | 5,376 | 5,612 | 5,146 | 5,223 |
| 2021 | 5,098 | 4,592 | 5,583 | 5,560 | 5,897 | 5,774 | 5,843 | 6,018 | 5,690 | 5,725 | 5,498 | 5,734 |
| 2022 | 5,246 | 4,972 | 5,529 | 5,343 | 5,677 | 5,588 | 5,639 | 5,748 | 5,503 | 5,574 | 5,415 | 5,474 |
| 2023 | 5,212 | 4,993 | 5,546 | 5,478 | 5,818 | 5,654 | 5,647 | 5,887 | 5,472 | 5,767 | 5,567 | 5,617 |
| 2024 | 5,201 | 4,951 | 5,319 | 5,530 | 5,953 | 5,649 | 5,720 | 5,959 | 5,383 | 5,734 | 5,395 | 5,628 |
| 2025 | 5,330 | 4,955 | 5,624 | 5,714 | ||||||||
| - = No Data Reported; -- = Not Applicable; NA = Not Available; W = Withheld to avoid disclosure of individual company data. |
| Release Date: 6/30/2025 |
| Next Release Date: 7/31/2025 |