|
Download Data (XLS File) |
|
||||||||
|
||||||||
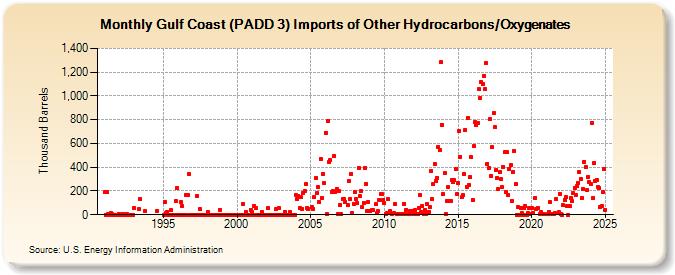
| Gulf Coast (PADD 3) Imports of Other Hydrocarbons/Oxygenates (Thousand Barrels) | ||||||||
| Year | Jan | Feb | Mar | Apr | May | Jun | Jul | Aug | Sep | Oct | Nov | Dec |
|---|---|---|---|---|---|---|---|---|---|---|---|---|
| 1991 | 189 | 0 | 189 | 7 | 0 | 13 | 8 | 0 | 0 | 0 | 0 | 0 |
| 1992 | 6 | 0 | 0 | 7 | 0 | 1 | 5 | 0 | 0 | 0 | 0 | 0 |
| 1993 | 58 | 44 | 131 | 29 | ||||||||
| 1994 | 34 | |||||||||||
| 1995 | 0 | 105 | 12 | 27 | 0 | 0 | 36 | 0 | 0 | 0 | 117 | 228 |
| 1996 | 0 | 0 | 107 | 74 | 0 | 0 | 167 | 0 | 163 | 339 | 0 | 0 |
| 1997 | 0 | 0 | 0 | 158 | 0 | 0 | 44 | 0 | 0 | 0 | 0 | 0 |
| 1998 | 22 | 0 | 0 | 0 | 0 | 0 | 0 | 0 | 0 | 0 | 42 | 0 |
| 1999 | 0 | 0 | 0 | 0 | 0 | 0 | 0 | 0 | 0 | 0 | 0 | 0 |
| 2000 | 0 | 0 | 0 | 0 | 0 | 94 | 0 | 25 | 0 | 0 | 0 | 43 |
| 2001 | 19 | 0 | 75 | 53 | 0 | 0 | 0 | 0 | 26 | 0 | 0 | 0 |
| 2002 | 0 | 56 | 0 | 0 | 0 | 0 | 0 | 0 | 48 | 0 | 55 | 0 |
| 2003 | 0 | 0 | 0 | 25 | 0 | 0 | 0 | 24 | 0 | 0 | 0 | 0 |
| 2004 | 163 | 131 | 158 | 53 | 145 | 49 | 179 | 199 | 256 | 60 | 52 | |
| 2005 | 64 | 52 | 149 | 310 | 179 | 235 | 105 | 470 | 144 | 344 | 263 | |
| 2006 | 691 | 4 | 788 | 443 | 461 | 193 | 198 | 498 | 192 | 217 | 3 | 198 |
| 2007 | 82 | 3 | 129 | 130 | 106 | 80 | 280 | 133 | 346 | 12 | 94 | |
| 2008 | 192 | 131 | 98 | 395 | 157 | 199 | 61 | 101 | 396 | 261 | 31 | 111 |
| 2009 | 29 | 37 | 38 | 86 | 14 | 29 | 124 | 176 | 172 | 128 | ||
| 2010 | 97 | 6 | 16 | 132 | 18 | 32 | 4 | 13 | 92 | 3 | 4 | |
| 2011 | 3 | 4 | 3 | 5 | 93 | 2 | 43 | 10 | 32 | 3 | 35 | |
| 2012 | 5 | 36 | 7 | 6 | 59 | 169 | 23 | 72 | 3 | 41 | 4 | 88 |
| 2013 | 26 | 64 | 368 | 129 | 257 | 425 | 280 | 310 | 569 | 544 | 1,282 | 759 |
| 2014 | 175 | 348 | 5 | 119 | 233 | 117 | 117 | 292 | 272 | 288 | 382 | 174 |
| 2015 | 269 | 705 | 486 | 146 | 163 | 344 | 712 | 236 | 816 | 248 | 316 | 482 |
| 2016 | 123 | 576 | 780 | 757 | 771 | 1,055 | 983 | 1,115 | 1,102 | 1,165 | 1,058 | 1,275 |
| 2017 | 429 | 392 | 805 | 330 | 567 | 855 | 736 | 378 | 309 | 213 | 358 | 298 |
| 2018 | 230 | 405 | 524 | 193 | 526 | 170 | 387 | 419 | 119 | 360 | 537 | 258 |
| 2019 | 0 | 64 | 1 | 60 | 15 | 0 | 54 | 75 | 0 | 12 | 57 | 5 |
| 2020 | 60 | 13 | 142 | 46 | 60 | 3 | 22 | 3 | ||||
| 2021 | 5 | 24 | 104 | 4 | 4 | 13 | 132 | 20 | 178 | |||
| 2022 | 7 | 0 | 78 | 126 | 146 | 71 | 0 | 71 | 142 | 114 | 181 | 225 |
| 2023 | 178 | 240 | 271 | 360 | 302 | 147 | 219 | 446 | 398 | 209 | 318 | 274 |
| 2024 | 257 | |||||||||||
| - = No Data Reported; -- = Not Applicable; NA = Not Available; W = Withheld to avoid disclosure of individual company data. |
| Release Date: 3/29/2024 |
| Next Release Date: 4/30/2024 |