|
Download Data (XLS File) |
|
||||||||
|
||||||||
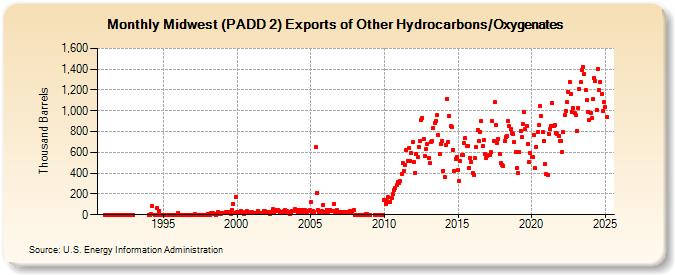
| Midwest (PADD 2) Exports of Other Hydrocarbons/Oxygenates (Thousand Barrels) | ||||||||
| Year | Jan | Feb | Mar | Apr | May | Jun | Jul | Aug | Sep | Oct | Nov | Dec |
|---|---|---|---|---|---|---|---|---|---|---|---|---|
| 1991 | 0 | 0 | 0 | 0 | 0 | 0 | 0 | 0 | 0 | 0 | 0 | 0 |
| 1992 | 0 | 0 | 0 | 0 | 0 | 0 | 0 | 0 | 0 | 0 | 0 | 0 |
| 1994 | 0 | 0 | 4 | 85 | 0 | 0 | 68 | 39 | 0 | 0 | 0 | |
| 1995 | 0 | 0 | 0 | 0 | 0 | 0 | 0 | 0 | 0 | 0 | 0 | 0 |
| 1996 | 21 | 1 | 0 | 0 | 0 | 0 | 0 | 0 | 0 | 0 | 1 | 0 |
| 1997 | 0 | 1 | 3 | 0 | 0 | 0 | 1 | 0 | 0 | 1 | 1 | 0 |
| 1998 | 11 | 1 | 1 | 13 | 12 | 4 | 6 | 1 | 25 | 6 | 21 | 11 |
| 1999 | 18 | 17 | 19 | 24 | 25 | 27 | 29 | 10 | 47 | 107 | 18 | 171 |
| 2000 | 29 | 30 | 28 | 33 | 27 | 18 | 11 | 23 | 31 | 27 | 12 | 12 |
| 2001 | 22 | 13 | 19 | 13 | 17 | 35 | 13 | 18 | 16 | 16 | 32 | 33 |
| 2002 | 23 | 16 | 22 | 6 | 27 | 52 | 12 | 41 | 34 | 48 | 38 | 24 |
| 2003 | 21 | 26 | 31 | 44 | 27 | 31 | 29 | 8 | 25 | 32 | 34 | 52 |
| 2004 | 45 | 41 | 26 | 48 | 18 | 49 | 20 | 49 | 26 | 30 | 36 | 42 |
| 2005 | 125 | 30 | 38 | 22 | 650 | 213 | 44 | 21 | 22 | 31 | 98 | 25 |
| 2006 | 17 | 50 | 28 | 33 | 46 | 36 | 37 | 107 | 27 | 46 | 29 | 29 |
| 2007 | 27 | 18 | 22 | 26 | 27 | 24 | 27 | 19 | 36 | 30 | 38 | 43 |
| 2008 | 2 | 2 | 0 | 1 | 1 | 1 | 1 | 1 | 4 | 3 | 0 | |
| 2009 | 0 | 1 | 1 | 0 | 1 | 0 | ||||||
| 2010 | 145 | 107 | 134 | 168 | 124 | 127 | 160 | 201 | 237 | 256 | 282 | 315 |
| 2011 | 304 | 320 | 392 | 496 | 422 | 478 | 626 | 519 | 637 | 513 | 592 | 695 |
| 2012 | 505 | 403 | 583 | 558 | 655 | 705 | 910 | 934 | 724 | 562 | 628 | 681 |
| 2013 | 545 | 493 | 702 | 712 | 832 | 885 | 901 | 956 | 768 | 581 | 682 | 711 |
| 2014 | 423 | 365 | 668 | 1,112 | 695 | 954 | 850 | 841 | 627 | 420 | 537 | 553 |
| 2015 | 428 | 325 | 512 | 573 | 571 | 689 | 739 | 664 | 665 | 454 | 547 | 505 |
| 2016 | 406 | 386 | 542 | 651 | 819 | 705 | 799 | 902 | 660 | 723 | 586 | 544 |
| 2017 | 568 | 574 | 579 | 604 | 901 | 705 | 1,081 | 860 | 690 | 732 | 580 | 494 |
| 2018 | 480 | 469 | 709 | 750 | 761 | 902 | 850 | 820 | 786 | 772 | 698 | 599 |
| 2019 | 449 | 403 | 606 | 801 | 743 | 872 | 984 | 822 | 855 | 682 | 506 | 596 |
| 2020 | 552 | 552 | 770 | 449 | 653 | 793 | 859 | 1,041 | 946 | 795 | 710 | 484 |
| 2021 | 387 | 383 | 778 | 822 | 856 | 1,074 | 854 | 864 | 787 | 776 | 754 | 710 |
| 2022 | 709 | 601 | 794 | 960 | 999 | 1,083 | 1,180 | 1,277 | 1,165 | 988 | 1,023 | 979 |
| 2023 | 987 | 829 | 1,048 | 1,220 | 1,287 | 1,412 | 1,440 | 1,372 | 1,215 | 1,122 | 1,012 | 917 |
| 2024 | 982 | |||||||||||
| - = No Data Reported; -- = Not Applicable; NA = Not Available; W = Withheld to avoid disclosure of individual company data. |
| Release Date: 3/29/2024 |
| Next Release Date: 4/30/2024 |