|
Download Data (XLS File) |


|
||||||||
|
||||||||
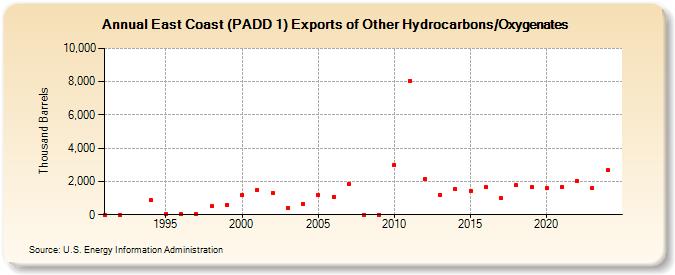
| East Coast (PADD 1) Exports of Other Hydrocarbons/Oxygenates (Thousand Barrels) | ||||||||
| Decade | Year-0 | Year-1 | Year-2 | Year-3 | Year-4 | Year-5 | Year-6 | Year-7 | Year-8 | Year-9 |
|---|---|---|---|---|---|---|---|---|---|---|
| 1990's | 0 | 0 | 873 | 55 | 15 | 40 | 503 | 604 | ||
| 2000's | 1,186 | 1,489 | 1,312 | 390 | 659 | 1,189 | 1,087 | 1,835 | 7 | 2 |
| 2010's | 2,980 | 8,062 | 2,156 | 1,204 | 1,531 | 1,441 | 1,662 | 986 | 1,766 | 1,654 |
| 2020's | 1,588 | 1,680 | 2,005 | 1,594 | 2,674 | 2,074 |
| - = No Data Reported; -- = Not Applicable; NA = Not Available; W = Withheld to avoid disclosure of individual company data. |
| Release Date: 9/30/2026 |
| Next Release Date: 8/31/2027 |