|
Download Data (XLS File) |
|
||||||||
|
||||||||
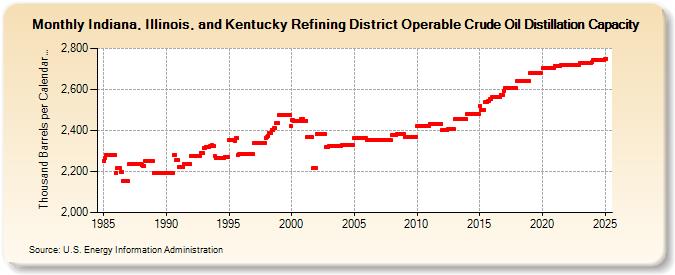
| Indiana, Illinois, and Kentucky Refining District Operable Crude Oil Distillation Capacity (Thousand Barrels per Calendar Day) | ||||||||
| Year | Jan | Feb | Mar | Apr | May | Jun | Jul | Aug | Sep | Oct | Nov | Dec |
|---|---|---|---|---|---|---|---|---|---|---|---|---|
| 1985 | 2,252 | 2,265 | 2,282 | 2,282 | 2,282 | 2,282 | 2,282 | 2,282 | 2,282 | 2,282 | 2,279 | 2,282 |
| 1986 | 2,192 | 2,217 | 2,217 | 2,217 | 2,217 | 2,198 | 2,198 | 2,153 | 2,153 | 2,153 | 2,153 | 2,153 |
| 1987 | 2,235 | 2,235 | 2,235 | 2,235 | 2,235 | 2,235 | 2,235 | 2,235 | 2,235 | 2,235 | 2,235 | 2,235 |
| 1988 | 2,235 | 2,233 | 2,229 | 2,229 | 2,249 | 2,249 | 2,253 | 2,253 | 2,253 | 2,253 | 2,253 | 2,253 |
| 1989 | 2,195 | 2,195 | 2,193 | 2,193 | 2,193 | 2,193 | 2,193 | 2,193 | 2,193 | 2,193 | 2,193 | 2,195 |
| 1990 | 2,194 | 2,194 | 2,194 | 2,194 | 2,194 | 2,194 | 2,194 | 2,281 | 2,281 | 2,254 | 2,254 | 2,254 |
| 1991 | 2,222 | 2,222 | 2,222 | 2,222 | 2,222 | 2,237 | 2,237 | 2,237 | 2,237 | 2,237 | 2,237 | 2,236 |
| 1992 | 2,278 | 2,278 | 2,278 | 2,278 | 2,278 | 2,278 | 2,278 | 2,278 | 2,278 | 2,292 | 2,292 | 2,292 |
| 1993 | 2,316 | 2,316 | 2,320 | 2,320 | 2,320 | 2,320 | 2,325 | 2,326 | 2,327 | 2,324 | 2,324 | 2,274 |
| 1994 | 2,267 | 2,267 | 2,267 | 2,267 | 2,267 | 2,267 | 2,267 | 2,267 | 2,273 | 2,273 | 2,273 | 2,273 |
| 1995 | 2,356 | 2,356 | 2,356 | 2,356 | 2,356 | 2,356 | 2,348 | 2,365 | 2,362 | 2,282 | 2,287 | 2,287 |
| 1996 | 2,285 | 2,285 | 2,285 | 2,285 | 2,285 | 2,285 | 2,285 | 2,285 | 2,285 | 2,285 | 2,285 | 2,285 |
| 1997 | 2,339 | 2,339 | 2,339 | 2,339 | 2,339 | 2,339 | 2,339 | 2,339 | 2,339 | 2,339 | 2,339 | 2,364 |
| 1998 | 2,369 | 2,374 | 2,389 | 2,389 | 2,389 | 2,404 | 2,404 | 2,410 | 2,410 | 2,435 | 2,436 | 2,436 |
| 1999 | 2,474 | 2,473 | 2,473 | 2,473 | 2,473 | 2,473 | 2,473 | 2,473 | 2,473 | 2,473 | 2,473 | 2,422 |
| 2000 | 2,450 | 2,450 | 2,447 | 2,447 | 2,447 | 2,447 | 2,447 | 2,447 | 2,447 | 2,457 | 2,457 | 2,457 |
| 2001 | 2,448 | 2,448 | 2,448 | 2,367 | 2,367 | 2,367 | 2,367 | 2,367 | 2,215 | 2,215 | 2,215 | 2,215 |
| 2002 | 2,382 | 2,382 | 2,382 | 2,382 | 2,382 | 2,382 | 2,382 | 2,382 | 2,382 | 2,318 | 2,318 | 2,318 |
| 2003 | 2,324 | 2,324 | 2,324 | 2,324 | 2,324 | 2,324 | 2,324 | 2,324 | 2,324 | 2,324 | 2,324 | 2,324 |
| 2004 | 2,327 | 2,327 | 2,327 | 2,327 | 2,327 | 2,327 | 2,327 | 2,327 | 2,327 | 2,327 | 2,327 | 2,327 |
| 2005 | 2,362 | 2,362 | 2,362 | 2,362 | 2,362 | 2,362 | 2,362 | 2,362 | 2,362 | 2,362 | 2,362 | 2,362 |
| 2006 | 2,355 | 2,355 | 2,355 | 2,355 | 2,355 | 2,355 | 2,355 | 2,355 | 2,355 | 2,355 | 2,355 | 2,355 |
| 2007 | 2,354 | 2,354 | 2,354 | 2,354 | 2,354 | 2,354 | 2,354 | 2,354 | 2,354 | 2,354 | 2,354 | 2,354 |
| 2008 | 2,377 | 2,377 | 2,377 | 2,377 | 2,377 | 2,381 | 2,381 | 2,381 | 2,381 | 2,381 | 2,381 | 2,381 |
| 2009 | 2,370 | 2,370 | 2,370 | 2,370 | 2,370 | 2,370 | 2,370 | 2,370 | 2,370 | 2,370 | 2,370 | 2,370 |
| 2010 | 2,422 | 2,422 | 2,422 | 2,422 | 2,422 | 2,422 | 2,422 | 2,422 | 2,422 | 2,422 | 2,422 | 2,422 |
| 2011 | 2,433 | 2,433 | 2,433 | 2,433 | 2,433 | 2,433 | 2,433 | 2,433 | 2,433 | 2,433 | 2,433 | 2,433 |
| 2012 | 2,401 | 2,401 | 2,401 | 2,401 | 2,401 | 2,401 | 2,408 | 2,408 | 2,409 | 2,409 | 2,409 | 2,409 |
| 2013 | 2,454 | 2,454 | 2,454 | 2,454 | 2,454 | 2,454 | 2,454 | 2,454 | 2,454 | 2,454 | 2,454 | 2,454 |
| 2014 | 2,480 | 2,480 | 2,480 | 2,480 | 2,480 | 2,480 | 2,480 | 2,480 | 2,480 | 2,480 | 2,480 | 2,480 |
| 2015 | 2,518 | 2,500 | 2,500 | 2,500 | 2,500 | 2,539 | 2,539 | 2,539 | 2,544 | 2,544 | 2,551 | 2,551 |
| 2016 | 2,562 | 2,562 | 2,562 | 2,562 | 2,562 | 2,562 | 2,562 | 2,562 | 2,575 | 2,575 | 2,575 | 2,594 |
| 2017 | 2,607 | 2,607 | 2,607 | 2,607 | 2,607 | 2,607 | 2,607 | 2,607 | 2,607 | 2,607 | 2,607 | 2,607 |
| 2018 | 2,640 | 2,640 | 2,640 | 2,640 | 2,640 | 2,640 | 2,640 | 2,640 | 2,640 | 2,640 | 2,640 | 2,640 |
| 2019 | 2,678 | 2,678 | 2,678 | 2,678 | 2,678 | 2,678 | 2,678 | 2,678 | 2,678 | 2,678 | 2,678 | 2,678 |
| 2020 | 2,703 | 2,703 | 2,703 | 2,703 | 2,703 | 2,703 | 2,703 | 2,703 | 2,703 | 2,703 | 2,703 | 2,703 |
| 2021 | 2,716 | 2,716 | 2,716 | 2,716 | 2,716 | 2,716 | 2,717 | 2,718 | 2,718 | 2,718 | 2,718 | 2,718 |
| 2022 | 2,721 | 2,721 | 2,721 | 2,721 | 2,721 | 2,721 | 2,721 | 2,721 | 2,721 | 2,721 | 2,721 | 2,721 |
| 2023 | 2,729 | 2,729 | 2,729 | 2,729 | 2,729 | 2,729 | 2,731 | 2,731 | 2,731 | 2,731 | 2,731 | 2,732 |
| 2024 | 2,741 | |||||||||||
| - = No Data Reported; -- = Not Applicable; NA = Not Available; W = Withheld to avoid disclosure of individual company data. |
| Release Date: 3/29/2024 |
| Next Release Date: 4/30/2024 |