|
Download Data (XLS File) |
|
||||||||
|
||||||||
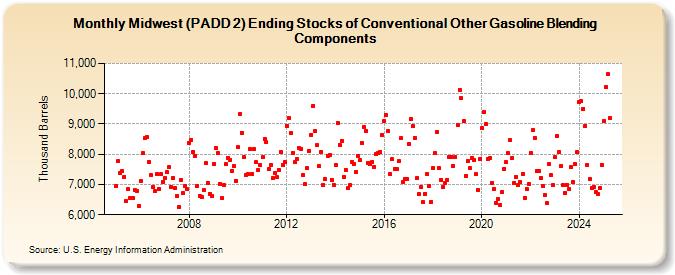
| Midwest (PADD 2) Ending Stocks of Conventional Other Gasoline Blending Components (Thousand Barrels) | ||||||||
| Year | Jan | Feb | Mar | Apr | May | Jun | Jul | Aug | Sep | Oct | Nov | Dec |
|---|---|---|---|---|---|---|---|---|---|---|---|---|
| 2005 | 6,936 | 7,771 | 7,390 | 7,436 | 7,260 | 6,453 | 6,834 | 6,540 | 6,552 | 6,810 | 6,788 | 6,295 |
| 2006 | 7,109 | 8,038 | 8,533 | 8,561 | 7,745 | 7,303 | 6,900 | 6,779 | 7,339 | 6,859 | 7,331 | 7,091 |
| 2007 | 7,218 | 7,398 | 7,569 | 6,911 | 7,220 | 6,899 | 6,630 | 6,260 | 7,154 | 6,717 | 6,965 | 6,839 |
| 2008 | 8,382 | 8,475 | 8,078 | 7,950 | 6,934 | 6,628 | 6,587 | 6,831 | 7,701 | 7,058 | 6,701 | 6,635 |
| 2009 | 7,688 | 8,209 | 8,038 | 7,024 | 6,554 | 6,997 | 7,672 | 7,891 | 7,817 | 7,449 | 7,607 | 7,130 |
| 2010 | 8,230 | 9,337 | 8,718 | 7,900 | 7,324 | 7,352 | 8,171 | 7,347 | 8,173 | 7,727 | 7,481 | 7,641 |
| 2011 | 7,897 | 8,503 | 8,391 | 7,511 | 7,648 | 7,211 | 7,375 | 7,239 | 7,486 | 8,082 | 7,634 | 7,750 |
| 2012 | 8,941 | 9,191 | 8,701 | 8,047 | 7,727 | 7,832 | 8,198 | 8,184 | 7,318 | 7,007 | 7,532 | 8,122 |
| 2013 | 8,645 | 9,598 | 8,758 | 8,304 | 7,606 | 8,076 | 6,991 | 7,177 | 7,951 | 7,981 | 7,161 | 6,996 |
| 2014 | 7,644 | 9,032 | 8,321 | 8,452 | 7,261 | 7,491 | 6,867 | 6,972 | 7,750 | 7,664 | 7,402 | 7,956 |
| 2015 | 7,800 | 8,383 | 8,906 | 8,762 | 7,720 | 7,667 | 7,744 | 7,591 | 8,013 | 8,032 | 8,071 | 8,638 |
| 2016 | 9,104 | 9,282 | 8,754 | 7,337 | 7,833 | 7,512 | 7,519 | 7,764 | 8,525 | 7,078 | 7,175 | 7,175 |
| 2017 | 8,351 | 9,160 | 8,920 | 8,549 | 7,206 | 6,674 | 6,919 | 6,412 | 6,701 | 7,347 | 6,938 | 6,431 |
| 2018 | 7,560 | 8,037 | 8,740 | 7,530 | 7,156 | 6,928 | 7,060 | 7,155 | 7,918 | 7,922 | 7,620 | 7,914 |
| 2019 | 8,951 | 10,135 | 9,848 | 9,091 | 7,290 | 7,784 | 7,536 | 7,882 | 7,820 | 7,334 | 6,832 | 7,830 |
| 2020 | 8,858 | 9,388 | 8,992 | 7,848 | 7,875 | 7,047 | 6,853 | 6,403 | 6,521 | 6,306 | 6,749 | 7,525 |
| 2021 | 7,732 | 8,025 | 8,456 | 7,888 | 7,052 | 7,259 | 6,997 | 7,073 | 7,355 | 6,565 | 6,857 | 7,016 |
| 2022 | 8,048 | 8,789 | 8,549 | 7,435 | 7,433 | 7,228 | 6,957 | 6,640 | 6,379 | 7,662 | 7,300 | 6,971 |
| 2023 | 7,894 | 8,605 | 8,072 | 7,617 | 6,998 | 6,704 | 6,935 | 6,850 | 7,570 | 7,089 | 7,676 | 8,061 |
| 2024 | 9,710 | 9,751 | 9,508 | 8,949 | ||||||||
| - = No Data Reported; -- = Not Applicable; NA = Not Available; W = Withheld to avoid disclosure of individual company data. |
| Release Date: 6/28/2024 |
| Next Release Date: 7/31/2024 |