|
Download Data (XLS File) |
|
||||||||
|
||||||||
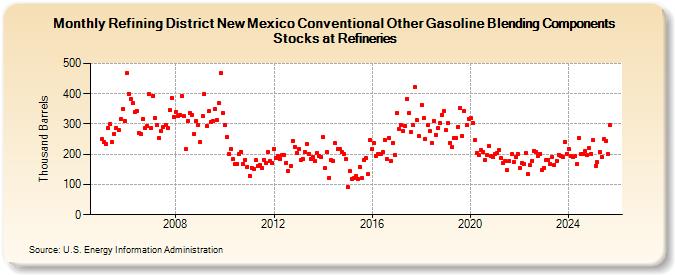
| Refining District New Mexico Conventional Other Gasoline Blending Components Stocks at Refineries (Thousand Barrels) | ||||||||
| Year | Jan | Feb | Mar | Apr | May | Jun | Jul | Aug | Sep | Oct | Nov | Dec |
|---|---|---|---|---|---|---|---|---|---|---|---|---|
| 2005 | 249 | 240 | 235 | 287 | 299 | 239 | 268 | 286 | 281 | 316 | 350 | 311 |
| 2006 | 467 | 400 | 384 | 368 | 338 | 344 | 271 | 268 | 317 | 287 | 294 | 398 |
| 2007 | 288 | 393 | 320 | 296 | 253 | 278 | 289 | 297 | 286 | 345 | 386 | 322 |
| 2008 | 340 | 326 | 331 | 391 | 326 | 216 | 311 | 336 | 330 | 267 | 310 | 297 |
| 2009 | 241 | 327 | 399 | 294 | 342 | 306 | 309 | 349 | 314 | 368 | 467 | 337 |
| 2010 | 295 | 256 | 200 | 217 | 183 | 169 | 169 | 200 | 208 | 167 | 181 | 159 |
| 2011 | 129 | 156 | 152 | 180 | 161 | 166 | 153 | 182 | 172 | 207 | 177 | 172 |
| 2012 | 217 | 187 | 194 | 185 | 196 | 198 | 171 | 143 | 160 | 245 | 225 | 205 |
| 2013 | 216 | 181 | 184 | 207 | 235 | 202 | 185 | 190 | 177 | 204 | 193 | 190 |
| 2014 | 257 | 153 | 208 | 122 | 180 | 179 | 236 | 216 | 217 | 208 | 200 | 183 |
| 2015 | 91 | 144 | 118 | 121 | 129 | 119 | 158 | 122 | 180 | 187 | 134 | 246 |
| 2016 | 217 | 237 | 195 | 200 | 202 | 206 | 248 | 185 | 255 | 178 | 238 | 198 |
| 2017 | 336 | 285 | 296 | 276 | 293 | 383 | 337 | 274 | 295 | 422 | 312 | 259 |
| 2018 | 364 | 319 | 250 | 296 | 276 | 238 | 311 | 265 | 288 | 302 | 331 | 342 |
| 2019 | 279 | 302 | 238 | 223 | 252 | 254 | 290 | 352 | 261 | 342 | 295 | 318 |
| 2020 | 319 | 303 | 246 | 205 | 199 | 214 | 208 | 182 | 198 | 228 | 195 | 191 |
| 2021 | 201 | 204 | 214 | 186 | 170 | 177 | 147 | 177 | 200 | 174 | 190 | 202 |
| 2022 | 154 | 171 | 167 | 204 | 133 | 163 | 179 | 212 | 207 | 194 | 202 | 148 |
| 2023 | 156 | 182 | 182 | 167 | 192 | 166 | 178 | 199 | 194 | 191 | 240 | 201 |
| 2024 | 218 | |||||||||||
| - = No Data Reported; -- = Not Applicable; NA = Not Available; W = Withheld to avoid disclosure of individual company data. |
| Release Date: 3/29/2024 |
| Next Release Date: 4/30/2024 |