|
Download Data (XLS File) |
|
||||||||
|
||||||||
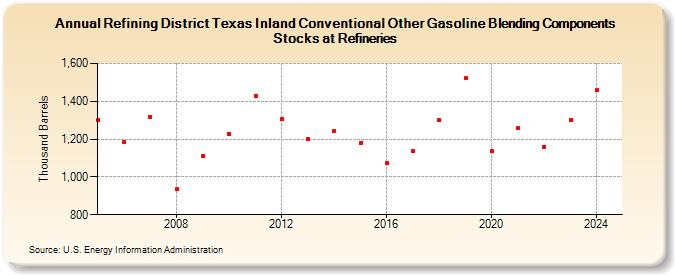
| Refining District Texas Inland Conventional Other Gasoline Blending Components Stocks at Refineries (Thousand Barrels) | ||||||||
| Decade | Year-0 | Year-1 | Year-2 | Year-3 | Year-4 | Year-5 | Year-6 | Year-7 | Year-8 | Year-9 |
|---|---|---|---|---|---|---|---|---|---|---|
| 2000's | 1,300 | 1,185 | 1,316 | 935 | 1,112 | |||||
| 2010's | 1,227 | 1,430 | 1,307 | 1,200 | 1,243 | 1,180 | 1,072 | 1,137 | 1,301 | 1,521 |
| 2020's | 1,135 | 1,257 | 1,159 | 1,303 |
| - = No Data Reported; -- = Not Applicable; NA = Not Available; W = Withheld to avoid disclosure of individual company data. |
| Release Date: 3/29/2024 |
| Next Release Date: 8/30/2024 |