|
Download Data (XLS File) |
|
||||||||
|
||||||||
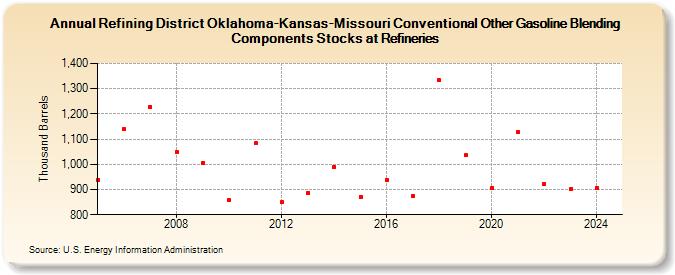
| Refining District Oklahoma-Kansas-Missouri Conventional Other Gasoline Blending Components Stocks at Refineries (Thousand Barrels) | ||||||||
| Decade | Year-0 | Year-1 | Year-2 | Year-3 | Year-4 | Year-5 | Year-6 | Year-7 | Year-8 | Year-9 |
|---|---|---|---|---|---|---|---|---|---|---|
| 2000's | 938 | 1,140 | 1,228 | 1,050 | 1,007 | |||||
| 2010's | 857 | 1,083 | 851 | 888 | 990 | 871 | 937 | 874 | 1,333 | 1,035 |
| 2020's | 906 | 1,127 | 921 | 902 |
| - = No Data Reported; -- = Not Applicable; NA = Not Available; W = Withheld to avoid disclosure of individual company data. |
| Release Date: 3/29/2024 |
| Next Release Date: 8/30/2024 |