|
Download Data (XLS File) |
|
||||||||
|
||||||||
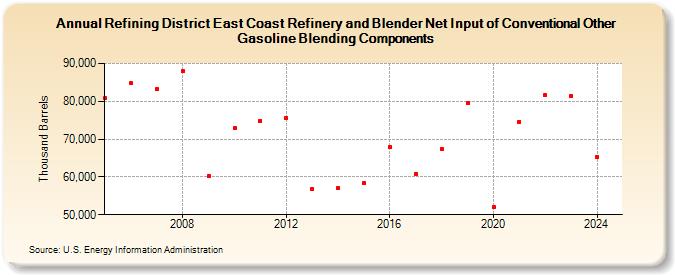
| Refining District East Coast Refinery and Blender Net Input of Conventional Other Gasoline Blending Components (Thousand Barrels) | ||||||||
| Decade | Year-0 | Year-1 | Year-2 | Year-3 | Year-4 | Year-5 | Year-6 | Year-7 | Year-8 | Year-9 |
|---|---|---|---|---|---|---|---|---|---|---|
| 2000's | 80,800 | 84,794 | 83,154 | 87,987 | 60,283 | |||||
| 2010's | 72,853 | 74,875 | 75,685 | 56,848 | 57,016 | 58,260 | 67,941 | 60,858 | 67,371 | 79,603 |
| 2020's | 52,075 | 74,635 | 81,595 | 82,241 |
| - = No Data Reported; -- = Not Applicable; NA = Not Available; W = Withheld to avoid disclosure of individual company data. |
| Release Date: 6/28/2024 |
| Next Release Date: 8/30/2024 |