|
Download Data (XLS File) |
|
||||||||
|
||||||||
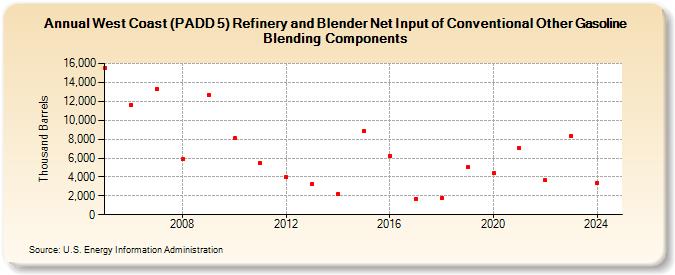
| West Coast (PADD 5) Refinery and Blender Net Input of Conventional Other Gasoline Blending Components (Thousand Barrels) | ||||||||
| Decade | Year-0 | Year-1 | Year-2 | Year-3 | Year-4 | Year-5 | Year-6 | Year-7 | Year-8 | Year-9 |
|---|---|---|---|---|---|---|---|---|---|---|
| 2000's | 15,542 | 11,625 | 13,318 | 5,852 | 12,695 | |||||
| 2010's | 8,082 | 5,477 | 3,977 | 3,289 | 2,211 | 8,866 | 6,213 | 1,706 | 1,761 | 5,019 |
| 2020's | 4,368 | 7,038 | 3,656 | 8,320 |
| - = No Data Reported; -- = Not Applicable; NA = Not Available; W = Withheld to avoid disclosure of individual company data. |
| Release Date: 3/29/2024 |
| Next Release Date: 8/30/2024 |