|
Download Data (XLS File) |
|
||||||||
|
||||||||
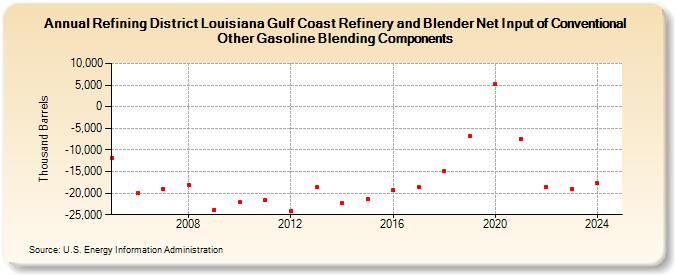
| Refining District Louisiana Gulf Coast Refinery and Blender Net Input of Conventional Other Gasoline Blending Components (Thousand Barrels) | ||||||||
| Decade | Year-0 | Year-1 | Year-2 | Year-3 | Year-4 | Year-5 | Year-6 | Year-7 | Year-8 | Year-9 |
|---|---|---|---|---|---|---|---|---|---|---|
| 2000's | -11,813 | -20,022 | -18,987 | -18,039 | -23,815 | |||||
| 2010's | -22,173 | -21,658 | -24,084 | -18,664 | -22,286 | -21,322 | -19,391 | -18,600 | -14,889 | -6,804 |
| 2020's | 5,330 | -7,421 | -18,577 | -18,970 |
| - = No Data Reported; -- = Not Applicable; NA = Not Available; W = Withheld to avoid disclosure of individual company data. |
| Release Date: 3/29/2024 |
| Next Release Date: 8/30/2024 |