|
Download Data (XLS File) |
|
||||||||
|
||||||||
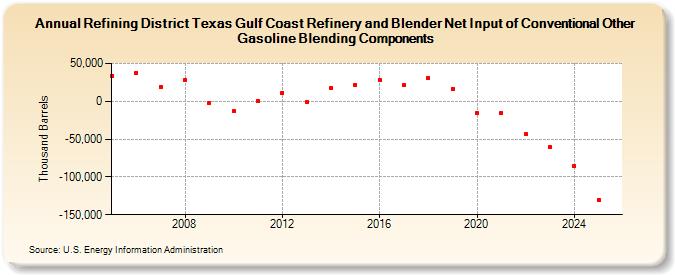
| Refining District Texas Gulf Coast Refinery and Blender Net Input of Conventional Other Gasoline Blending Components (Thousand Barrels) | ||||||||
| Decade | Year-0 | Year-1 | Year-2 | Year-3 | Year-4 | Year-5 | Year-6 | Year-7 | Year-8 | Year-9 |
|---|---|---|---|---|---|---|---|---|---|---|
| 2000's | 33,837 | 37,742 | 19,298 | 28,293 | -2,007 | |||||
| 2010's | -12,922 | 768 | 11,394 | -845 | 17,705 | 21,653 | 28,300 | 21,374 | 31,150 | 16,794 |
| 2020's | -15,490 | -15,296 | -43,423 | -60,215 |
| - = No Data Reported; -- = Not Applicable; NA = Not Available; W = Withheld to avoid disclosure of individual company data. |
| Release Date: 4/30/2024 |
| Next Release Date: 8/30/2024 |