|
Download Data (XLS File) |
|
||||||||
|
||||||||
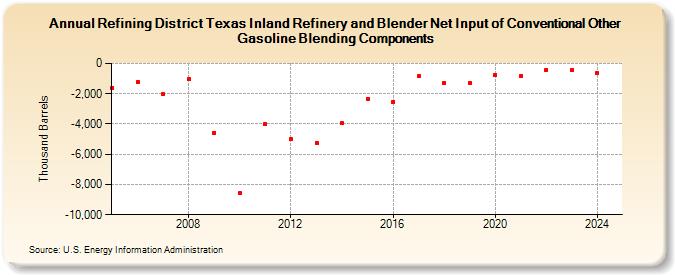
| Refining District Texas Inland Refinery and Blender Net Input of Conventional Other Gasoline Blending Components (Thousand Barrels) | ||||||||
| Decade | Year-0 | Year-1 | Year-2 | Year-3 | Year-4 | Year-5 | Year-6 | Year-7 | Year-8 | Year-9 |
|---|---|---|---|---|---|---|---|---|---|---|
| 2000's | -1,614 | -1,198 | -2,032 | -1,037 | -4,578 | |||||
| 2010's | -8,557 | -4,011 | -5,000 | -5,230 | -3,931 | -2,327 | -2,534 | -857 | -1,272 | -1,271 |
| 2020's | -749 | -836 | -405 | -415 |
| - = No Data Reported; -- = Not Applicable; NA = Not Available; W = Withheld to avoid disclosure of individual company data. |
| Release Date: 6/28/2024 |
| Next Release Date: 8/30/2024 |