|
Download Data (XLS File) |
|
||||||||
|
||||||||
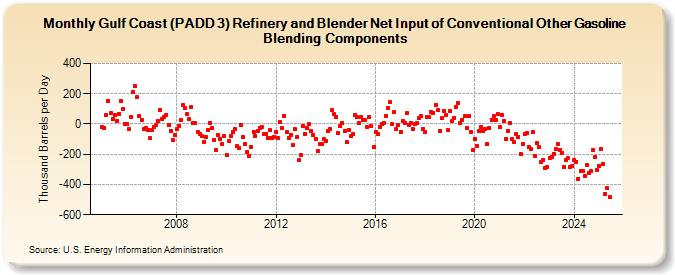
| Gulf Coast (PADD 3) Refinery and Blender Net Input of Conventional Other Gasoline Blending Components (Thousand Barrels per Day) | ||||||||
| Year | Jan | Feb | Mar | Apr | May | Jun | Jul | Aug | Sep | Oct | Nov | Dec |
|---|---|---|---|---|---|---|---|---|---|---|---|---|
| 2005 | -22 | -28 | 60 | 155 | 70 | 34 | 57 | 20 | 69 | 149 | 98 | 3 |
| 2006 | 0 | -36 | 45 | 212 | 248 | 178 | 55 | 26 | -32 | -26 | -39 | -96 |
| 2007 | -37 | -18 | -8 | 20 | 94 | 33 | 47 | 60 | -10 | -46 | -105 | -73 |
| 2008 | -36 | -13 | 24 | 123 | 103 | 64 | 31 | 109 | 9 | 4 | -55 | -64 |
| 2009 | -80 | -118 | -83 | -39 | 9 | -25 | -104 | -175 | -75 | -100 | -135 | -80 |
| 2010 | -203 | -112 | -79 | -56 | -32 | -148 | -162 | -7 | -83 | -134 | -185 | -210 |
| 2011 | -155 | -53 | -78 | -45 | -24 | -22 | -65 | -67 | -90 | -42 | -90 | -87 |
| 2012 | -51 | -94 | 13 | -29 | 55 | -55 | -91 | -73 | -139 | -35 | -87 | -236 |
| 2013 | -208 | -12 | -64 | -28 | -2 | -49 | -70 | -98 | -181 | -130 | -131 | -102 |
| 2014 | -112 | -49 | -33 | 90 | 64 | 44 | -58 | -15 | 5 | -48 | -122 | -38 |
| 2015 | -82 | -68 | 61 | 49 | 6 | 45 | 23 | 25 | -20 | 48 | -12 | -149 |
| 2016 | -51 | -63 | -21 | 1 | 5 | 56 | 104 | 143 | -2 | 79 | -36 | -10 |
| 2017 | -56 | 22 | 7 | 71 | -4 | 6 | -34 | -2 | 6 | 38 | 51 | -36 |
| 2018 | -54 | 47 | 45 | 76 | 74 | 126 | 94 | -46 | 37 | 88 | 57 | -42 |
| 2019 | 86 | 19 | 41 | 109 | 138 | 6 | 29 | 52 | -28 | 51 | -53 | -175 |
| 2020 | -98 | -143 | -46 | -23 | -47 | -30 | -131 | -27 | 29 | 54 | 25 | 69 |
| 2021 | -18 | 62 | 22 | -99 | -44 | 6 | -100 | -119 | -67 | -83 | -198 | -134 |
| 2022 | -68 | -57 | -149 | -165 | -56 | -209 | -123 | -151 | -249 | -236 | -294 | -284 |
| 2023 | -227 | -216 | -196 | -167 | -134 | -171 | -194 | -284 | -237 | -227 | -285 | -276 |
| 2024 | -234 | -217 | -365 | -308 | -311 | -343 | ||||||
| - = No Data Reported; -- = Not Applicable; NA = Not Available; W = Withheld to avoid disclosure of individual company data. |
| Release Date: 8/30/2024 |
| Next Release Date: 9/30/2024 |