|
Download Data (XLS File) |
|
||||||||
|
||||||||
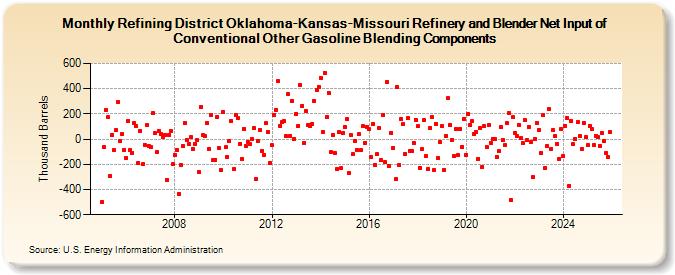
| Refining District Oklahoma-Kansas-Missouri Refinery and Blender Net Input of Conventional Other Gasoline Blending Components (Thousand Barrels) | ||||||||
| Year | Jan | Feb | Mar | Apr | May | Jun | Jul | Aug | Sep | Oct | Nov | Dec |
|---|---|---|---|---|---|---|---|---|---|---|---|---|
| 2005 | -497 | -66 | 231 | 174 | -289 | 34 | -87 | 71 | 296 | -16 | 41 | -85 |
| 2006 | -149 | 144 | -87 | -108 | 129 | 102 | -188 | 67 | -200 | -44 | 108 | -54 |
| 2007 | -63 | 206 | 47 | -105 | 64 | 40 | 18 | 35 | -321 | 35 | 67 | -200 |
| 2008 | -128 | -89 | -433 | -206 | -53 | 129 | -8 | -41 | 13 | -76 | -37 | -9 |
| 2009 | -264 | 257 | 32 | 22 | 127 | -76 | 189 | -162 | -162 | 179 | -74 | -248 |
| 2010 | 216 | -66 | -142 | -14 | 142 | -240 | 194 | 171 | -35 | -156 | 83 | -53 |
| 2011 | -20 | -42 | 0 | 87 | -320 | -13 | 73 | -92 | -126 | 125 | 56 | -187 |
| 2012 | -50 | 189 | 233 | 458 | 106 | 133 | 142 | 21 | 355 | 28 | 305 | 4 |
| 2013 | 201 | 106 | 431 | 265 | -29 | 221 | 113 | 103 | 120 | 304 | 391 | 416 |
| 2014 | 485 | 57 | 528 | 174 | 369 | -104 | 33 | -108 | -236 | 55 | -233 | 50 |
| 2015 | 98 | 158 | -271 | 33 | -122 | -12 | -86 | 37 | -90 | 100 | -27 | 98 |
| 2016 | 77 | -141 | 120 | -202 | -121 | 92 | -168 | 195 | -184 | 453 | -213 | 49 |
| 2017 | -67 | -317 | 413 | -206 | 157 | 117 | -117 | 165 | -93 | -97 | -28 | 154 |
| 2018 | 103 | -226 | -82 | 150 | -138 | -239 | 89 | 179 | -247 | 122 | -150 | -26 |
| 2019 | 102 | -242 | 28 | 325 | 111 | -7 | -136 | 78 | -128 | 83 | -62 | 162 |
| 2020 | -123 | 202 | 110 | 140 | 41 | 59 | -154 | 90 | -221 | 103 | -62 | 108 |
| 2021 | -29 | 1 | -3 | -142 | -97 | 94 | -11 | -49 | 127 | 208 | -482 | 173 |
| 2022 | 51 | 23 | 114 | 8 | -34 | 148 | -8 | 97 | -21 | -302 | 2 | 131 |
| 2023 | 71 | -109 | 188 | -230 | -55 | 237 | -77 | 69 | 24 | -35 | -155 | 81 |
| 2024 | -135 | 107 | ||||||||||
| - = No Data Reported; -- = Not Applicable; NA = Not Available; W = Withheld to avoid disclosure of individual company data. |
| Release Date: 4/30/2024 |
| Next Release Date: 5/31/2024 |