|
Download Data (XLS File) |
|
||||||||
|
||||||||
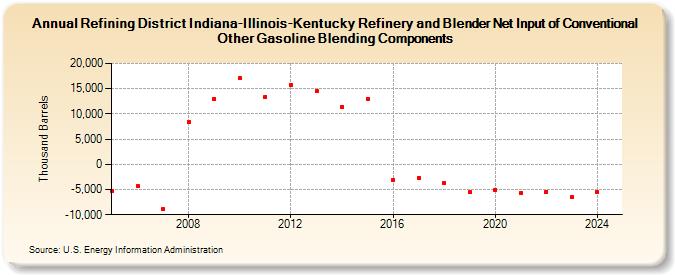
| Refining District Indiana-Illinois-Kentucky Refinery and Blender Net Input of Conventional Other Gasoline Blending Components (Thousand Barrels) | ||||||||
| Decade | Year-0 | Year-1 | Year-2 | Year-3 | Year-4 | Year-5 | Year-6 | Year-7 | Year-8 | Year-9 |
|---|---|---|---|---|---|---|---|---|---|---|
| 2000's | -5,250 | -4,249 | -8,888 | 8,452 | 13,053 | |||||
| 2010's | 17,022 | 13,448 | 15,753 | 14,588 | 11,417 | 13,036 | -3,118 | -2,653 | -3,672 | -5,553 |
| 2020's | -5,043 | -5,603 | -5,417 | -6,569 |
| - = No Data Reported; -- = Not Applicable; NA = Not Available; W = Withheld to avoid disclosure of individual company data. |
| Release Date: 6/28/2024 |
| Next Release Date: 8/30/2024 |