|
Download Data (XLS File) |
|
||||||||
|
||||||||
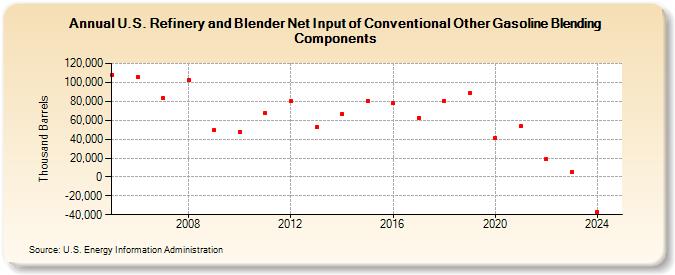
| U.S. Refinery and Blender Net Input of Conventional Other Gasoline Blending Components (Thousand Barrels) | ||||||||
| Decade | Year-0 | Year-1 | Year-2 | Year-3 | Year-4 | Year-5 | Year-6 | Year-7 | Year-8 | Year-9 |
|---|---|---|---|---|---|---|---|---|---|---|
| 2000's | 108,339 | 105,623 | 83,479 | 102,408 | 49,362 | |||||
| 2010's | 47,806 | 67,809 | 80,270 | 52,728 | 66,818 | 80,678 | 77,698 | 62,260 | 80,487 | 88,953 |
| 2020's | 41,612 | 53,339 | 18,467 | 5,923 |
| - = No Data Reported; -- = Not Applicable; NA = Not Available; W = Withheld to avoid disclosure of individual company data. |
| Release Date: 3/29/2024 |
| Next Release Date: 8/30/2024 |