|
Download Data (XLS File) |
|
||||||||
|
||||||||
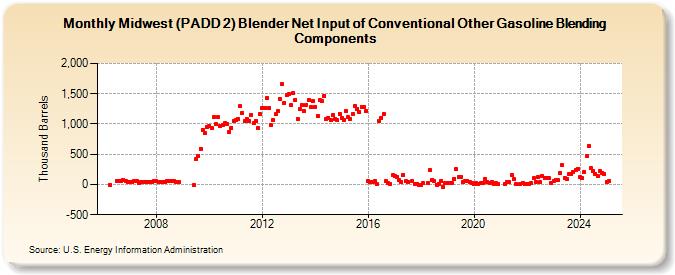
| Midwest (PADD 2) Blender Net Input of Conventional Other Gasoline Blending Components (Thousand Barrels) | ||||||||
| Year | Jan | Feb | Mar | Apr | May | Jun | Jul | Aug | Sep | Oct | Nov | Dec |
|---|---|---|---|---|---|---|---|---|---|---|---|---|
| 2006 | -6 | 65 | 55 | 65 | 70 | 60 | 46 | |||||
| 2007 | 49 | 40 | 53 | 50 | 31 | 42 | 37 | 33 | 48 | 46 | 47 | 51 |
| 2008 | 51 | 48 | 47 | 48 | 41 | 54 | 54 | 52 | 59 | 44 | 37 | |
| 2009 | -13 | 422 | 463 | 592 | 906 | 848 | 947 | |||||
| 2010 | 974 | 931 | 1,112 | 995 | 1,111 | 972 | 990 | 1,008 | 1,002 | 870 | 937 | 1,054 |
| 2011 | 1,061 | 1,082 | 1,294 | 1,189 | 1,046 | 1,083 | 1,055 | 1,153 | 1,019 | 1,051 | 927 | 1,163 |
| 2012 | 1,257 | 1,268 | 1,424 | 1,261 | 978 | 1,065 | 1,158 | 1,208 | 1,415 | 1,656 | 1,347 | 1,478 |
| 2013 | 1,493 | 1,308 | 1,509 | 1,402 | 1,083 | 1,253 | 1,313 | 1,213 | 1,321 | 1,394 | 1,273 | 1,381 |
| 2014 | 1,287 | 1,133 | 1,393 | 1,373 | 1,464 | 1,074 | 1,101 | 1,059 | 1,151 | 1,089 | 1,060 | 1,173 |
| 2015 | 1,105 | 1,066 | 1,211 | 1,113 | 1,084 | 1,165 | 1,300 | 1,249 | 1,198 | 1,283 | 1,282 | 1,210 |
| 2016 | 54 | 47 | 41 | 52 | 4 | 1,053 | 1,100 | 1,170 | 55 | 24 | 5 | 152 |
| 2017 | 142 | 124 | 73 | 33 | 164 | 53 | 44 | 56 | 14 | 3 | -3 | |
| 2018 | -1 | 17 | 23 | 239 | 75 | 51 | -3 | 14 | 50 | -43 | 26 | |
| 2019 | 18 | 30 | 20 | 97 | 250 | 123 | 130 | 35 | 53 | 54 | 39 | 18 |
| 2020 | 5 | 23 | 16 | 21 | 30 | 98 | 33 | 32 | 44 | 12 | 17 | 9 |
| 2021 | 6 | 48 | 46 | 154 | 86 | 6 | 6 | 29 | 10 | |||
| 2022 | 3 | 12 | 17 | 99 | 43 | 123 | 34 | 139 | 110 | 105 | 100 | 25 |
| 2023 | 51 | 78 | 69 | 188 | 316 | 110 | 93 | 165 | 167 | 214 | 237 | 261 |
| 2024 | 119 | 106 | 202 | 464 | 640 | 268 | 224 | 179 | 144 | 217 | 196 | 167 |
| 2025 | 41 | 61 | 144 | 327 | ||||||||
| - = No Data Reported; -- = Not Applicable; NA = Not Available; W = Withheld to avoid disclosure of individual company data. |
| Release Date: 6/30/2025 |
| Next Release Date: 7/31/2025 |