|
Download Data (XLS File) |
|
||||||||
|
||||||||
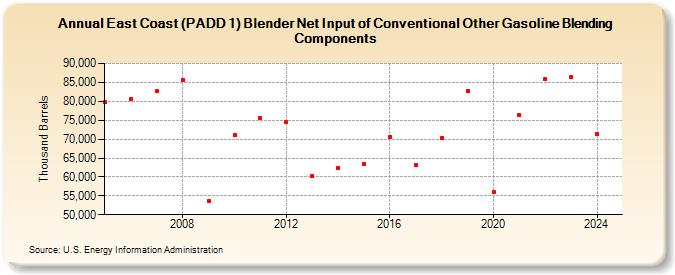
| East Coast (PADD 1) Blender Net Input of Conventional Other Gasoline Blending Components (Thousand Barrels) | ||||||||
| Decade | Year-0 | Year-1 | Year-2 | Year-3 | Year-4 | Year-5 | Year-6 | Year-7 | Year-8 | Year-9 |
|---|---|---|---|---|---|---|---|---|---|---|
| 2000's | 79,682 | 80,625 | 82,658 | 85,682 | 53,730 | |||||
| 2010's | 71,203 | 75,696 | 74,544 | 60,201 | 62,444 | 63,292 | 70,686 | 63,025 | 70,188 | 82,832 |
| 2020's | 55,928 | 76,339 | 85,792 | 86,339 |
| - = No Data Reported; -- = Not Applicable; NA = Not Available; W = Withheld to avoid disclosure of individual company data. |
| Release Date: 8/30/2024 |
| Next Release Date: 8/29/2025 |