|
Download Data (XLS File) |
|
||||||||
|
||||||||
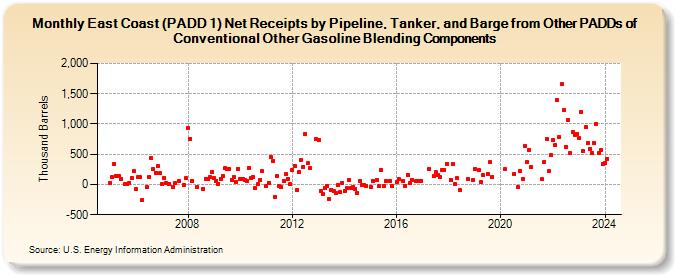
| East Coast (PADD 1) Net Receipts by Pipeline, Tanker, and Barge from Other PADDs of Conventional Other Gasoline Blending Components (Thousand Barrels) | ||||||||
| Year | Jan | Feb | Mar | Apr | May | Jun | Jul | Aug | Sep | Oct | Nov | Dec |
|---|---|---|---|---|---|---|---|---|---|---|---|---|
| 2005 | 22 | 117 | 344 | 134 | 148 | 98 | 0 | 15 | 31 | 112 | 216 | |
| 2006 | -82 | 131 | 119 | -254 | -42 | 131 | 443 | 252 | 195 | 311 | 183 | |
| 2007 | 9 | 107 | 24 | 0 | -40 | 19 | 51 | -1 | 102 | |||
| 2008 | 926 | 757 | 63 | -45 | -74 | 96 | 87 | 121 | 201 | |||
| 2009 | 101 | 63 | 9 | 96 | 141 | 268 | 253 | 258 | 79 | 119 | 45 | 260 |
| 2010 | 97 | 86 | 78 | 60 | 277 | 104 | 127 | -60 | 3 | 67 | 219 | |
| 2011 | -21 | 25 | 452 | 391 | -206 | 140 | -24 | -41 | 64 | 171 | 97 | 6 |
| 2012 | 245 | 304 | -88 | 199 | 407 | 292 | 832 | 350 | 268 | 752 | ||
| 2013 | 731 | -106 | -158 | -52 | -20 | -248 | -88 | -113 | -134 | -1 | -132 | 31 |
| 2014 | -104 | -57 | 77 | -66 | -38 | -70 | -140 | 58 | -5 | -10 | -20 | |
| 2015 | -40 | 50 | 73 | -25 | 241 | -25 | 50 | 62 | -25 | |||
| 2016 | 47 | 84 | 63 | -25 | 164 | 18 | 67 | 51 | 53 | 50 | ||
| 2017 | 259 | 140 | 202 | 159 | 119 | 240 | 242 | 339 | ||||
| 2018 | 81 | 332 | 15 | 100 | -84 | 84 | 70 | |||||
| 2019 | 250 | 232 | 37 | 150 | 176 | 367 | 124 | |||||
| 2020 | 249 | 170 | -50 | 218 | 96 | 635 | ||||||
| 2021 | 364 | 577 | 282 | 83 | 377 | 758 | 215 | 479 | ||||
| 2022 | 729 | 655 | 1,403 | 783 | 1,655 | 1,231 | 627 | 1,068 | 512 | 860 | 816 | 838 |
| 2023 | 771 | 1,198 | 552 | 944 | 684 | 587 | 519 | 693 | 1,004 | 514 | 563 | 340 |
| 2024 | 354 | |||||||||||
| - = No Data Reported; -- = Not Applicable; NA = Not Available; W = Withheld to avoid disclosure of individual company data. |
| Release Date: 3/29/2024 |
| Next Release Date: 4/30/2024 |
Referring Pages: