|
Download Data (XLS File) |
|
||||||||
|
||||||||
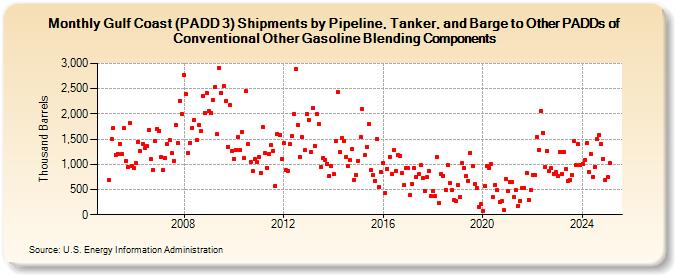
| Gulf Coast (PADD 3) Shipments by Pipeline, Tanker, and Barge to Other PADDs of Conventional Other Gasoline Blending Components (Thousand Barrels) | ||||||||
| Year | Jan | Feb | Mar | Apr | May | Jun | Jul | Aug | Sep | Oct | Nov | Dec |
|---|---|---|---|---|---|---|---|---|---|---|---|---|
| 2005 | 695 | 1,499 | 1,716 | 1,191 | 1,212 | 1,409 | 1,214 | 1,712 | 1,066 | 942 | 1,823 | 973 |
| 2006 | 923 | 1,016 | 1,452 | 1,256 | 1,412 | 1,316 | 1,363 | 1,676 | 1,097 | 895 | 1,459 | 1,707 |
| 2007 | 1,663 | 1,154 | 895 | 1,132 | 1,395 | 1,479 | 1,217 | 1,069 | 1,776 | 1,419 | 2,263 | 2,006 |
| 2008 | 2,776 | 2,389 | 1,222 | 1,429 | 1,724 | 1,875 | 1,483 | 1,775 | 1,661 | 2,352 | 2,017 | 2,416 |
| 2009 | 2,054 | 2,021 | 2,282 | 2,535 | 1,595 | 2,906 | 2,424 | 2,554 | 2,251 | 1,353 | 2,171 | 1,270 |
| 2010 | 1,107 | 1,288 | 1,538 | 1,287 | 1,647 | 1,117 | 2,446 | 1,400 | 1,048 | 865 | 1,099 | 1,044 |
| 2011 | 1,136 | 836 | 1,734 | 1,222 | 929 | 1,201 | 1,378 | 1,273 | 577 | 1,609 | 1,588 | 1,110 |
| 2012 | 1,414 | 881 | 873 | 1,400 | 1,557 | 2,004 | 2,892 | 1,779 | 1,153 | 1,532 | 1,275 | 1,994 |
| 2013 | 1,885 | 1,250 | 2,121 | 1,369 | 2,003 | 1,798 | 943 | 1,123 | 1,095 | 1,010 | 774 | 964 |
| 2014 | 801 | 1,461 | 2,438 | 1,252 | 1,523 | 1,463 | 1,142 | 967 | 1,086 | 1,305 | 695 | 786 |
| 2015 | 1,073 | 1,540 | 2,100 | 1,179 | 1,343 | 1,799 | 879 | 788 | 672 | 1,511 | 557 | 847 |
| 2016 | 1,029 | 429 | 913 | 1,152 | 810 | 1,287 | 871 | 1,194 | 1,165 | 819 | 587 | 933 |
| 2017 | 925 | 395 | 619 | 923 | 752 | 803 | 982 | 732 | 469 | 745 | 859 | 368 |
| 2018 | 466 | 363 | 1,142 | 230 | 798 | 774 | 499 | 987 | 633 | 490 | 291 | 275 |
| 2019 | 588 | 355 | 1,025 | 926 | 765 | 678 | 1,233 | 964 | 600 | 536 | 149 | 204 |
| 2020 | 80 | 569 | 968 | 934 | 1,013 | 348 | 598 | 495 | 243 | 266 | 96 | 710 |
| 2021 | 470 | 658 | 656 | 342 | 482 | 178 | 273 | 536 | 538 | 828 | 297 | 486 |
| 2022 | 779 | 781 | 1,545 | 1,285 | 2,061 | 1,627 | 941 | 1,266 | 875 | 918 | 816 | 838 |
| 2023 | 771 | 1,251 | 810 | 1,248 | 910 | 673 | 686 | 793 | 1,456 | 979 | 1,398 | 993 |
| 2024 | 1,007 | |||||||||||
| - = No Data Reported; -- = Not Applicable; NA = Not Available; W = Withheld to avoid disclosure of individual company data. |
| Release Date: 3/29/2024 |
| Next Release Date: 4/30/2024 |
Referring Pages: