|
Download Data (XLS File) |
|
||||||||
|
||||||||
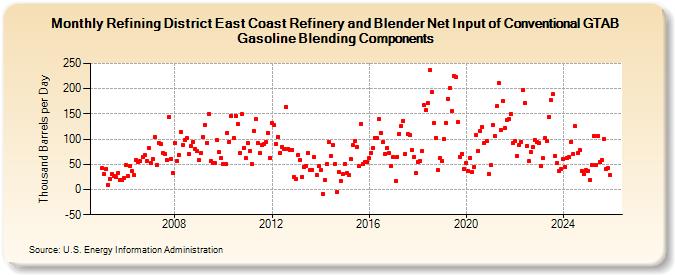
| Refining District East Coast Refinery and Blender Net Input of Conventional GTAB Gasoline Blending Components (Thousand Barrels per Day) | ||||||||
| Year | Jan | Feb | Mar | Apr | May | Jun | Jul | Aug | Sep | Oct | Nov | Dec |
|---|---|---|---|---|---|---|---|---|---|---|---|---|
| 2005 | 42 | 30 | 41 | 9 | 21 | 30 | 27 | 24 | 33 | 19 | 19 | 23 |
| 2006 | 49 | 26 | 47 | 36 | 28 | 59 | 55 | 56 | 64 | 68 | 57 | 83 |
| 2007 | 53 | 61 | 104 | 49 | 93 | 91 | 73 | 71 | 59 | 144 | 61 | 33 |
| 2008 | 92 | 57 | 68 | 115 | 89 | 99 | 102 | 70 | 86 | 94 | 81 | 76 |
| 2009 | 59 | 72 | 104 | 128 | 93 | 150 | 56 | 53 | 52 | 98 | 74 | 63 |
| 2010 | 50 | 51 | 113 | 95 | 146 | 102 | 146 | 129 | 72 | 149 | 83 | 62 |
| 2011 | 92 | 76 | 51 | 117 | 139 | 92 | 72 | 88 | 91 | 94 | 113 | 63 |
| 2012 | 131 | 127 | 91 | 105 | 73 | 85 | 81 | 164 | 81 | 79 | 79 | 25 |
| 2013 | 20 | 69 | 58 | 25 | 44 | 47 | 73 | 39 | 39 | 64 | 29 | 46 |
| 2014 | 39 | -8 | 19 | 50 | 94 | 67 | 88 | 51 | -5 | 35 | 17 | 31 |
| 2015 | 51 | 33 | 29 | 61 | 88 | 96 | 84 | 46 | 130 | 50 | 55 | 55 |
| 2016 | 62 | 73 | 83 | 103 | 102 | 140 | 113 | 94 | 71 | 83 | 72 | 47 |
| 2017 | 64 | 17 | 65 | 111 | 126 | 136 | 71 | 110 | 109 | 78 | 64 | 33 |
| 2018 | 55 | 57 | 76 | 167 | 157 | 172 | 237 | 193 | 132 | 103 | 39 | 62 |
| 2019 | 57 | 100 | 132 | 180 | 201 | 155 | 225 | 223 | 134 | 65 | 71 | 41 |
| 2020 | 53 | 37 | 63 | 35 | 44 | 108 | 77 | 116 | 124 | 93 | 96 | 31 |
| 2021 | 48 | 128 | 106 | 165 | 212 | 118 | 175 | 122 | 138 | 139 | 150 | 92 |
| 2022 | 96 | 67 | 88 | 95 | 197 | 172 | 87 | 56 | 74 | 84 | 98 | 95 |
| 2023 | 93 | 47 | 62 | 102 | 97 | 144 | 177 | 189 | 67 | 53 | 36 | 41 |
| 2024 | 61 | 44 | 63 | 64 | ||||||||
| - = No Data Reported; -- = Not Applicable; NA = Not Available; W = Withheld to avoid disclosure of individual company data. |
| Release Date: 6/28/2024 |
| Next Release Date: 7/31/2024 |