|
Download Data (XLS File) |
|
||||||||
|
||||||||
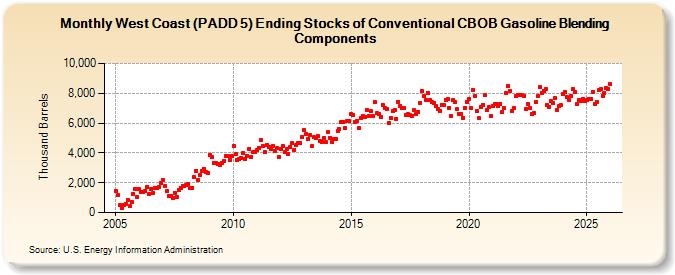
| West Coast (PADD 5) Ending Stocks of Conventional CBOB Gasoline Blending Components (Thousand Barrels) | ||||||||
| Year | Jan | Feb | Mar | Apr | May | Jun | Jul | Aug | Sep | Oct | Nov | Dec |
|---|---|---|---|---|---|---|---|---|---|---|---|---|
| 2005 | 1,454 | 1,167 | 510 | 276 | 515 | 599 | 842 | 428 | 741 | 1,254 | 1,584 | 1,059 |
| 2006 | 1,557 | 1,404 | 1,407 | 1,478 | 1,739 | 1,258 | 1,612 | 1,290 | 1,645 | 1,622 | 1,699 | 1,976 |
| 2007 | 2,210 | 1,766 | 1,449 | 1,079 | 1,121 | 978 | 1,341 | 1,069 | 1,533 | 1,675 | 1,772 | 1,769 |
| 2008 | 1,832 | 1,924 | 1,640 | 1,680 | 2,380 | 2,808 | 2,190 | 2,514 | 2,761 | 2,942 | 2,709 | 2,651 |
| 2009 | 3,863 | 3,704 | 3,352 | 3,338 | 3,278 | 3,194 | 3,327 | 3,444 | 3,806 | 3,808 | 3,551 | 3,784 |
| 2010 | 4,487 | 3,904 | 3,549 | 3,604 | 3,644 | 4,000 | 3,619 | 3,805 | 4,296 | 3,746 | 4,040 | 4,085 |
| 2011 | 4,206 | 4,362 | 4,878 | 4,477 | 4,050 | 4,536 | 4,422 | 4,236 | 4,481 | 4,160 | 4,318 | 3,756 |
| 2012 | 4,267 | 4,458 | 4,037 | 4,258 | 3,939 | 4,405 | 4,639 | 4,201 | 4,523 | 4,680 | 4,670 | 5,082 |
| 2013 | 5,521 | 5,287 | 4,942 | 5,207 | 4,466 | 5,048 | 5,019 | 5,122 | 4,823 | 4,764 | 4,995 | 4,732 |
| 2014 | 5,374 | 5,024 | 4,712 | 4,915 | 4,905 | 5,461 | 5,579 | 6,054 | 6,071 | 5,685 | 6,133 | 6,115 |
| 2015 | 6,637 | 6,569 | 6,100 | 6,171 | 5,656 | 6,328 | 6,455 | 6,402 | 6,907 | 6,469 | 6,790 | 6,506 |
| 2016 | 7,402 | 6,658 | 6,630 | 6,396 | 7,236 | 7,043 | 6,968 | 6,015 | 6,375 | 6,800 | 6,898 | 6,307 |
| 2017 | 7,441 | 7,174 | 7,006 | 6,982 | 6,525 | 6,612 | 6,517 | 6,481 | 6,859 | 6,597 | 6,766 | 7,367 |
| 2018 | 8,185 | 7,795 | 7,579 | 8,045 | 7,523 | 7,428 | 7,362 | 7,115 | 6,976 | 6,827 | 7,223 | 7,205 |
| 2019 | 7,562 | 7,597 | 7,046 | 6,510 | 7,536 | 7,385 | 6,929 | 6,626 | 6,610 | 6,347 | 7,034 | 7,416 |
| 2020 | 7,618 | 7,022 | 8,243 | 7,815 | 6,835 | 6,339 | 7,055 | 7,215 | 7,868 | 6,877 | 7,054 | 6,473 |
| 2021 | 7,178 | 7,273 | 7,284 | 7,139 | 7,298 | 6,768 | 6,981 | 8,034 | 8,492 | 8,166 | 6,830 | 6,996 |
| 2022 | 7,810 | 7,913 | 7,853 | 7,879 | 7,840 | 6,969 | 7,263 | 7,023 | 6,641 | 6,690 | 7,402 | 7,787 |
| 2023 | 8,389 | 8,026 | 8,179 | 8,269 | 7,191 | 7,187 | 7,512 | 7,371 | 7,684 | 6,912 | 7,142 | 7,204 |
| 2024 | 7,950 | |||||||||||
| - = No Data Reported; -- = Not Applicable; NA = Not Available; W = Withheld to avoid disclosure of individual company data. |
| Release Date: 3/29/2024 |
| Next Release Date: 4/30/2024 |