|
Download Data (XLS File) |
|
||||||||
|
||||||||
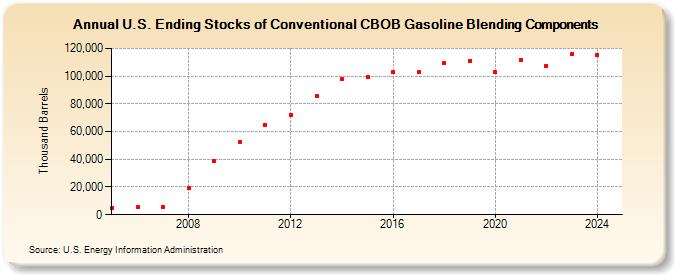
| U.S. Ending Stocks of Conventional CBOB Gasoline Blending Components (Thousand Barrels) | ||||||||
| Decade | Year-0 | Year-1 | Year-2 | Year-3 | Year-4 | Year-5 | Year-6 | Year-7 | Year-8 | Year-9 |
|---|---|---|---|---|---|---|---|---|---|---|
| 2000's | 4,705 | 5,867 | 5,620 | 19,380 | 38,817 | |||||
| 2010's | 52,586 | 64,830 | 72,261 | 85,970 | 97,709 | 99,348 | 102,641 | 102,652 | 109,288 | 110,920 |
| 2020's | 103,048 | 111,840 | 107,234 | 115,780 | 115,265 |
| - = No Data Reported; -- = Not Applicable; NA = Not Available; W = Withheld to avoid disclosure of individual company data. |
| Release Date: 6/30/2025 |
| Next Release Date: 8/29/2025 |