|
Download Data (XLS File) |
|
||||||||
|
||||||||
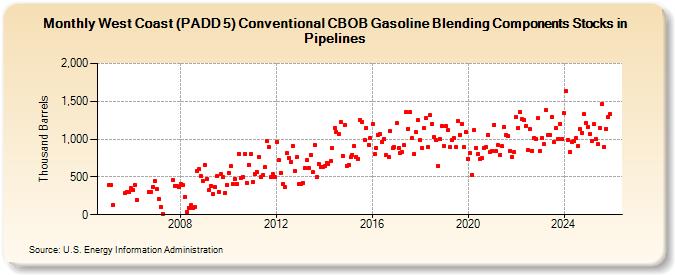
| West Coast (PADD 5) Conventional CBOB Gasoline Blending Components Stocks in Pipelines (Thousand Barrels) | ||||||||
| Year | Jan | Feb | Mar | Apr | May | Jun | Jul | Aug | Sep | Oct | Nov | Dec |
|---|---|---|---|---|---|---|---|---|---|---|---|---|
| 2005 | 399 | 397 | 125 | 283 | 294 | 301 | 347 | |||||
| 2006 | 331 | 391 | 195 | 294 | 303 | 371 | 443 | |||||
| 2007 | 337 | 214 | 103 | 15 | 458 | 378 | 376 | 366 | ||||
| 2008 | 411 | 389 | 237 | 40 | 91 | 124 | 90 | 103 | 583 | 598 | 517 | 448 |
| 2009 | 662 | 473 | 323 | 381 | 279 | 371 | 508 | 300 | 534 | 494 | 288 | 392 |
| 2010 | 553 | 639 | 407 | 475 | 412 | 808 | 487 | 497 | 805 | 425 | 664 | 798 |
| 2011 | 433 | 543 | 569 | 765 | 496 | 520 | 629 | 977 | 896 | 493 | 533 | 497 |
| 2012 | 962 | 718 | 557 | 411 | 362 | 810 | 754 | 696 | 915 | 580 | 762 | 401 |
| 2013 | 403 | 422 | 618 | 717 | 615 | 796 | 559 | 919 | 493 | 674 | 628 | 634 |
| 2014 | 640 | 688 | 674 | 707 | 876 | 1,142 | 1,097 | 1,061 | 1,225 | 783 | 1,184 | 641 |
| 2015 | 655 | 757 | 796 | 908 | 768 | 740 | 1,256 | 1,227 | 993 | 1,152 | 924 | 1,020 |
| 2016 | 1,198 | 797 | 881 | 1,059 | 1,063 | 960 | 998 | 789 | 769 | 1,107 | 878 | 891 |
| 2017 | 1,210 | 880 | 820 | 829 | 916 | 1,360 | 1,138 | 1,353 | 1,011 | 804 | 1,088 | 1,250 |
| 2018 | 986 | 888 | 1,146 | 1,278 | 898 | 1,313 | 1,202 | 1,024 | 982 | 646 | 997 | 1,169 |
| 2019 | 906 | 1,170 | 1,117 | 894 | 988 | 1,014 | 896 | 1,239 | 1,060 | 1,205 | 891 | 1,094 |
| 2020 | 738 | 814 | 531 | 1,119 | 883 | 804 | 738 | 746 | 885 | 889 | 1,051 | 834 |
| 2021 | 847 | 1,191 | 839 | 918 | 790 | 905 | 1,158 | 1,059 | 1,044 | 847 | 767 | 830 |
| 2022 | 1,291 | 1,152 | 1,353 | 1,261 | 1,247 | 1,176 | 858 | 1,129 | 848 | 1,017 | 995 | 1,274 |
| 2023 | 838 | 1,015 | 929 | 1,383 | 1,057 | 1,055 | 1,292 | 963 | 1,144 | 1,005 | 1,206 | 999 |
| 2024 | 1,339 | 1,631 | 987 | 835 | ||||||||
| - = No Data Reported; -- = Not Applicable; NA = Not Available; W = Withheld to avoid disclosure of individual company data. |
| Release Date: 6/28/2024 |
| Next Release Date: 7/31/2024 |