|
Download Data (XLS File) |
|
||||||||
|
||||||||
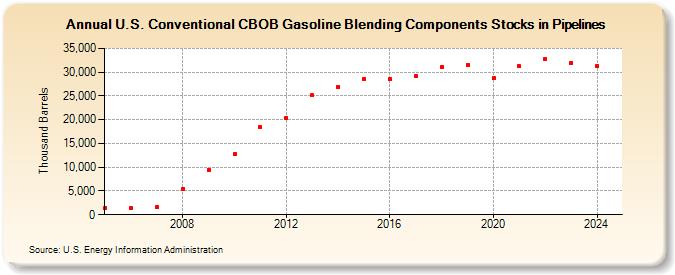
| U.S. Conventional CBOB Gasoline Blending Components Stocks in Pipelines (Thousand Barrels) | ||||||||
| Decade | Year-0 | Year-1 | Year-2 | Year-3 | Year-4 | Year-5 | Year-6 | Year-7 | Year-8 | Year-9 |
|---|---|---|---|---|---|---|---|---|---|---|
| 2000's | 1,392 | 1,399 | 1,528 | 5,370 | 9,476 | |||||
| 2010's | 12,682 | 18,445 | 20,401 | 25,091 | 26,956 | 28,607 | 28,513 | 29,099 | 31,097 | 31,583 |
| 2020's | 28,685 | 31,202 | 32,815 | 31,986 |
| - = No Data Reported; -- = Not Applicable; NA = Not Available; W = Withheld to avoid disclosure of individual company data. |
| Release Date: 8/30/2024 |
| Next Release Date: 8/29/2025 |