|
Download Data (XLS File) |
|
||||||||
|
||||||||
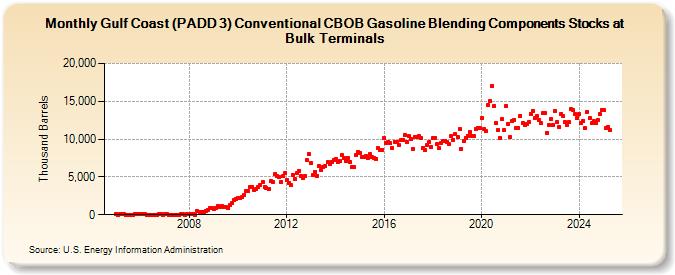
| Gulf Coast (PADD 3) Conventional CBOB Gasoline Blending Components Stocks at Bulk Terminals (Thousand Barrels) | ||||||||
| Year | Jan | Feb | Mar | Apr | May | Jun | Jul | Aug | Sep | Oct | Nov | Dec |
|---|---|---|---|---|---|---|---|---|---|---|---|---|
| 2005 | 60 | 9 | 39 | 38 | 55 | 17 | 26 | 12 | 13 | 109 | 47 | 131 |
| 2006 | 131 | 89 | 31 | 3 | 12 | 12 | 11 | 10 | 9 | 40 | 42 | 19 |
| 2007 | 35 | 34 | 25 | 7 | 16 | 3 | 27 | 12 | 56 | 62 | 25 | 48 |
| 2008 | 53 | 107 | 18 | 432 | 405 | 301 | 323 | 519 | 686 | 850 | 881 | |
| 2009 | 752 | 939 | 1,109 | 1,072 | 1,199 | 992 | 972 | 854 | 1,241 | 1,538 | 1,920 | 2,061 |
| 2010 | 2,201 | 2,193 | 2,292 | 2,600 | 3,147 | 3,093 | 3,601 | 3,693 | 3,265 | 3,404 | 3,684 | 3,978 |
| 2011 | 4,342 | 3,728 | 3,509 | 3,454 | 4,424 | 4,376 | 5,342 | 5,129 | 4,993 | 4,337 | 5,065 | 5,506 |
| 2012 | 4,627 | 4,217 | 3,883 | 5,308 | 4,667 | 5,462 | 5,847 | 5,123 | 4,846 | 5,078 | 7,181 | 8,060 |
| 2013 | 6,824 | 5,215 | 5,691 | 5,144 | 6,385 | 5,946 | 6,343 | 6,463 | 6,920 | 6,726 | 6,980 | 7,291 |
| 2014 | 7,372 | 6,922 | 7,086 | 7,883 | 7,511 | 7,142 | 7,553 | 7,016 | 6,287 | 6,278 | 7,848 | 8,356 |
| 2015 | 8,226 | 7,657 | 7,612 | 7,793 | 7,536 | 7,973 | 7,593 | 7,512 | 7,422 | 8,766 | 8,614 | 8,617 |
| 2016 | 10,189 | 9,501 | 9,610 | 9,424 | 8,834 | 9,669 | 9,657 | 9,225 | 9,832 | 9,869 | 10,510 | 9,615 |
| 2017 | 10,408 | 9,989 | 8,720 | 10,282 | 10,214 | 10,370 | 10,186 | 8,874 | 8,562 | 9,158 | 9,579 | 8,987 |
| 2018 | 10,084 | 10,112 | 9,310 | 8,767 | 9,531 | 9,740 | 9,806 | 9,613 | 9,286 | 10,421 | 9,921 | 10,652 |
| 2019 | 10,334 | 11,328 | 8,739 | 9,714 | 10,171 | 10,471 | 10,938 | 10,460 | 10,363 | 11,328 | 11,469 | 11,439 |
| 2020 | 12,727 | 11,271 | 11,015 | 14,562 | 15,009 | 16,992 | 14,378 | 12,088 | 11,196 | 10,168 | 12,601 | 11,196 |
| 2021 | 14,384 | 11,993 | 10,231 | 12,395 | 12,557 | 11,490 | 11,522 | 13,102 | 12,126 | 11,914 | 11,986 | 12,248 |
| 2022 | 13,382 | 13,760 | 12,729 | 13,048 | 12,500 | 12,127 | 13,388 | 13,449 | 10,861 | 11,915 | 12,621 | 11,860 |
| 2023 | 13,735 | 12,173 | 11,526 | 13,398 | 13,075 | 12,267 | 11,889 | 12,231 | 13,941 | 13,788 | 13,341 | 12,845 |
| 2024 | 13,351 | 12,158 | 12,437 | 11,426 | ||||||||
| - = No Data Reported; -- = Not Applicable; NA = Not Available; W = Withheld to avoid disclosure of individual company data. |
| Release Date: 6/28/2024 |
| Next Release Date: 7/31/2024 |