|
Download Data (XLS File) |
|
||||||||
|
||||||||
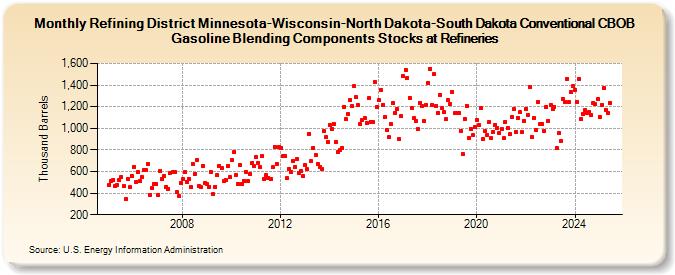
| Refining District Minnesota-Wisconsin-North Dakota-South Dakota Conventional CBOB Gasoline Blending Components Stocks at Refineries (Thousand Barrels) | ||||||||
| Year | Jan | Feb | Mar | Apr | May | Jun | Jul | Aug | Sep | Oct | Nov | Dec |
|---|---|---|---|---|---|---|---|---|---|---|---|---|
| 2005 | 479 | 510 | 524 | 470 | 472 | 519 | 549 | 462 | 347 | 532 | 454 | 563 |
| 2006 | 644 | 502 | 594 | 509 | 551 | 612 | 610 | 665 | 387 | 444 | 485 | 483 |
| 2007 | 379 | 606 | 526 | 563 | 460 | 442 | 590 | 595 | 594 | 406 | 369 | 496 |
| 2008 | 528 | 592 | 505 | 535 | 458 | 674 | 579 | 706 | 463 | 452 | 651 | 496 |
| 2009 | 481 | 460 | 592 | 390 | 457 | 565 | 651 | 629 | 508 | 523 | 651 | 547 |
| 2010 | 703 | 782 | 568 | 485 | 657 | 487 | 516 | 600 | 511 | 579 | 680 | 648 |
| 2011 | 732 | 679 | 638 | 742 | 534 | 565 | 543 | 530 | 639 | 831 | 672 | 830 |
| 2012 | 816 | 739 | 748 | 536 | 624 | 594 | 699 | 640 | 716 | 583 | 603 | 555 |
| 2013 | 660 | 622 | 951 | 693 | 820 | 754 | 674 | 646 | 622 | 974 | 915 | 874 |
| 2014 | 1,035 | 998 | 1,040 | 877 | 782 | 798 | 822 | 1,200 | 1,086 | 1,129 | 1,260 | 1,204 |
| 2015 | 1,388 | 1,286 | 1,213 | 1,038 | 1,079 | 1,092 | 1,047 | 1,278 | 1,059 | 1,054 | 1,430 | 1,194 |
| 2016 | 1,259 | 1,358 | 1,220 | 1,101 | 982 | 919 | 1,036 | 1,234 | 1,145 | 1,179 | 898 | 1,110 |
| 2017 | 1,483 | 1,542 | 1,466 | 1,283 | 1,185 | 1,091 | 1,069 | 993 | 1,237 | 1,204 | 1,072 | 1,220 |
| 2018 | 1,422 | 1,552 | 1,217 | 1,500 | 1,208 | 1,145 | 1,312 | 1,192 | 1,153 | 1,083 | 1,262 | 1,227 |
| 2019 | 1,340 | 1,139 | 1,141 | 1,138 | 978 | 761 | 1,087 | 1,210 | 912 | 996 | 934 | 1,014 |
| 2020 | 1,077 | 1,028 | 1,185 | 901 | 971 | 940 | 1,054 | 910 | 964 | 1,031 | 1,003 | 959 |
| 2021 | 991 | 907 | 1,060 | 1,006 | 943 | 1,105 | 1,177 | 967 | 1,098 | 1,149 | 966 | 1,071 |
| 2022 | 1,181 | 1,121 | 1,383 | 921 | 1,094 | 986 | 1,245 | 1,036 | 1,037 | 974 | 1,200 | 1,072 |
| 2023 | 1,219 | 1,179 | 1,201 | 818 | 957 | 880 | 1,274 | 1,244 | 1,459 | 1,245 | 1,338 | 1,390 |
| 2024 | 1,359 | |||||||||||
| - = No Data Reported; -- = Not Applicable; NA = Not Available; W = Withheld to avoid disclosure of individual company data. |
| Release Date: 3/29/2024 |
| Next Release Date: 4/30/2024 |