|
Download Data (XLS File) |
|
||||||||
|
||||||||
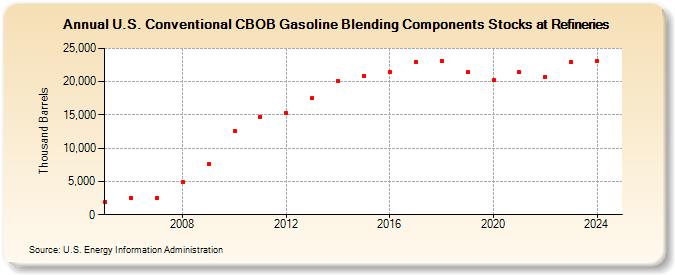
| U.S. Conventional CBOB Gasoline Blending Components Stocks at Refineries (Thousand Barrels) | ||||||||
| Decade | Year-0 | Year-1 | Year-2 | Year-3 | Year-4 | Year-5 | Year-6 | Year-7 | Year-8 | Year-9 |
|---|---|---|---|---|---|---|---|---|---|---|
| 2000's | 1,879 | 2,540 | 2,550 | 4,845 | 7,609 | |||||
| 2010's | 12,649 | 14,748 | 15,273 | 17,550 | 20,130 | 20,832 | 21,471 | 23,012 | 23,105 | 21,424 |
| 2020's | 20,238 | 21,403 | 20,706 | 22,990 |
| - = No Data Reported; -- = Not Applicable; NA = Not Available; W = Withheld to avoid disclosure of individual company data. |
| Release Date: 3/29/2024 |
| Next Release Date: 8/30/2024 |