|
Download Data (XLS File) |
|
||||||||
|
||||||||
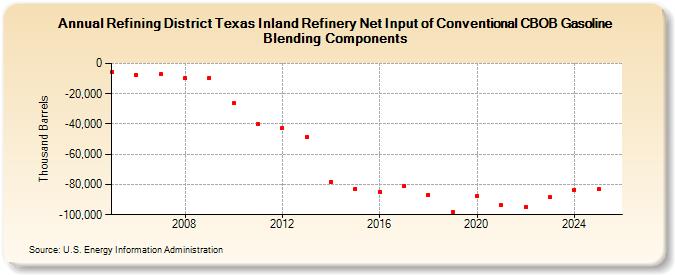
| Refining District Texas Inland Refinery Net Input of Conventional CBOB Gasoline Blending Components (Thousand Barrels) | ||||||||
| Decade | Year-0 | Year-1 | Year-2 | Year-3 | Year-4 | Year-5 | Year-6 | Year-7 | Year-8 | Year-9 |
|---|---|---|---|---|---|---|---|---|---|---|
| 2000's | -5,872 | -7,643 | -7,144 | -9,800 | -9,420 | |||||
| 2010's | -26,315 | -40,086 | -42,841 | -48,711 | -78,046 | -82,800 | -84,743 | -81,210 | -86,764 | -98,061 |
| 2020's | -87,763 | -93,830 | -94,868 | -88,510 |
| - = No Data Reported; -- = Not Applicable; NA = Not Available; W = Withheld to avoid disclosure of individual company data. |
| Release Date: 3/29/2024 |
| Next Release Date: 8/30/2024 |