|
Download Data (XLS File) |
|
||||||||
|
||||||||
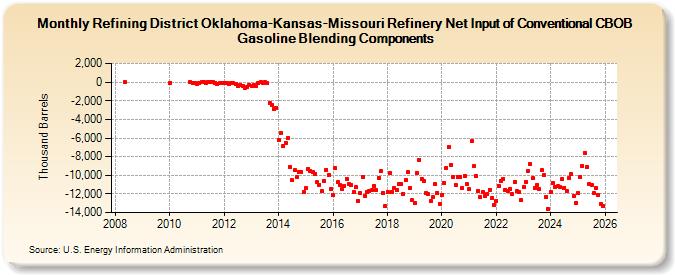
| Refining District Oklahoma-Kansas-Missouri Refinery Net Input of Conventional CBOB Gasoline Blending Components (Thousand Barrels) | ||||||||
| Year | Jan | Feb | Mar | Apr | May | Jun | Jul | Aug | Sep | Oct | Nov | Dec |
|---|---|---|---|---|---|---|---|---|---|---|---|---|
| 2008 | -1 | |||||||||||
| 2010 | -70 | -25 | -57 | -80 | ||||||||
| 2011 | -160 | -121 | -23 | 31 | -53 | 16 | -15 | 16 | -57 | -195 | -133 | -129 |
| 2012 | -134 | -81 | -180 | -130 | -125 | -176 | -412 | -258 | -411 | -650 | -488 | -299 |
| 2013 | -380 | -259 | -389 | -147 | -23 | -94 | -4 | -136 | -2,295 | -2,405 | -2,833 | -2,733 |
| 2014 | -6,225 | -5,469 | -6,861 | -6,526 | -6,008 | -9,095 | -10,557 | -9,471 | -10,205 | -9,628 | -9,636 | -11,839 |
| 2015 | -11,384 | -9,284 | -9,527 | -9,596 | -9,820 | -10,752 | -11,007 | -11,737 | -10,583 | -9,391 | -9,972 | -11,486 |
| 2016 | -12,143 | -9,226 | -10,762 | -11,027 | -11,464 | -11,150 | -10,352 | -10,925 | -11,000 | -11,796 | -11,304 | -12,721 |
| 2017 | -11,933 | -10,206 | -12,176 | -11,838 | -11,727 | -11,613 | -11,120 | -11,607 | -10,264 | -9,581 | -11,857 | -13,347 |
| 2018 | -11,760 | -9,797 | -11,805 | -11,412 | -11,613 | -10,977 | -10,971 | -11,969 | -10,507 | -9,699 | -11,358 | -12,696 |
| 2019 | -12,960 | -9,727 | -8,357 | -10,355 | -10,564 | -11,880 | -12,029 | -12,775 | -12,359 | -10,966 | -11,865 | -13,085 |
| 2020 | -12,080 | -10,833 | -9,182 | -6,943 | -8,847 | -10,164 | -11,053 | -10,206 | -10,169 | -11,369 | -10,064 | -10,960 |
| 2021 | -11,518 | -6,323 | -9,055 | -10,052 | -11,657 | -12,309 | -11,817 | -12,210 | -11,984 | -11,546 | -12,434 | -13,159 |
| 2022 | -12,738 | -11,098 | -10,581 | -10,384 | -11,528 | -11,671 | -11,468 | -12,031 | -10,696 | -11,739 | -11,788 | -12,680 |
| 2023 | -11,301 | -10,675 | -9,557 | -8,812 | -10,326 | -11,360 | -11,039 | -11,485 | -9,461 | -9,984 | -12,338 | -13,610 |
| 2024 | -11,806 | |||||||||||
| - = No Data Reported; -- = Not Applicable; NA = Not Available; W = Withheld to avoid disclosure of individual company data. |
| Release Date: 3/29/2024 |
| Next Release Date: 4/30/2024 |