|
Download Data (XLS File) |
|
||||||||
|
||||||||
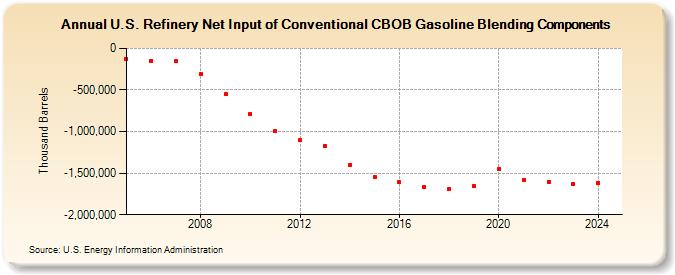
| U.S. Refinery Net Input of Conventional CBOB Gasoline Blending Components (Thousand Barrels) | ||||||||
| Decade | Year-0 | Year-1 | Year-2 | Year-3 | Year-4 | Year-5 | Year-6 | Year-7 | Year-8 | Year-9 |
|---|---|---|---|---|---|---|---|---|---|---|
| 2000's | -126,996 | -147,094 | -147,880 | -309,710 | -553,152 | |||||
| 2010's | -786,637 | -996,648 | -1,106,110 | -1,168,078 | -1,403,174 | -1,545,143 | -1,611,905 | -1,669,528 | -1,690,180 | -1,649,158 |
| 2020's | -1,447,716 | -1,582,139 | -1,607,385 | -1,633,397 |
| - = No Data Reported; -- = Not Applicable; NA = Not Available; W = Withheld to avoid disclosure of individual company data. |
| Release Date: 3/29/2024 |
| Next Release Date: 8/30/2024 |