|
Download Data (XLS File) |
|
||||||||
|
||||||||
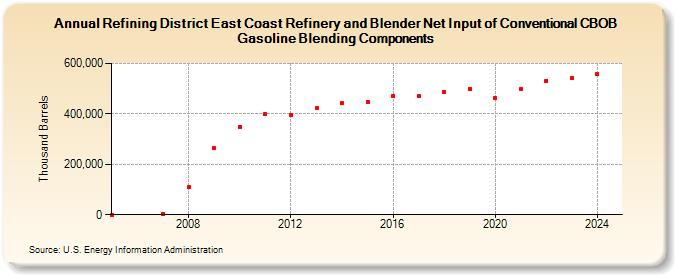
| Refining District East Coast Refinery and Blender Net Input of Conventional CBOB Gasoline Blending Components (Thousand Barrels) | ||||||||
| Decade | Year-0 | Year-1 | Year-2 | Year-3 | Year-4 | Year-5 | Year-6 | Year-7 | Year-8 | Year-9 |
|---|---|---|---|---|---|---|---|---|---|---|
| 2000's | 68 | 4,150 | 110,005 | 263,360 | ||||||
| 2010's | 349,690 | 399,161 | 396,199 | 421,860 | 442,031 | 449,064 | 469,249 | 471,871 | 485,645 | 499,948 |
| 2020's | 462,331 | 499,087 | 531,939 | 542,360 |
| - = No Data Reported; -- = Not Applicable; NA = Not Available; W = Withheld to avoid disclosure of individual company data. |
| Release Date: 3/29/2024 |
| Next Release Date: 8/30/2024 |