|
Download Data (XLS File) |
|
||||||||
|
||||||||
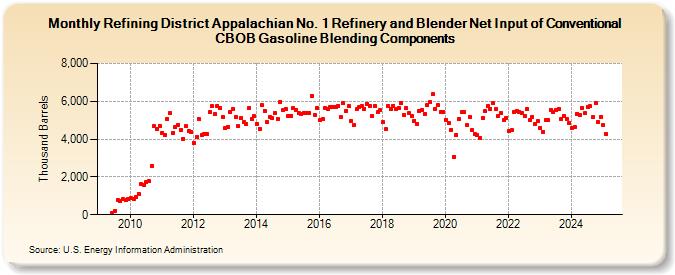
| Refining District Appalachian No. 1 Refinery and Blender Net Input of Conventional CBOB Gasoline Blending Components (Thousand Barrels) | ||||||||
| Year | Jan | Feb | Mar | Apr | May | Jun | Jul | Aug | Sep | Oct | Nov | Dec |
|---|---|---|---|---|---|---|---|---|---|---|---|---|
| 2009 | 66 | 213 | 769 | 707 | 818 | 755 | 811 | |||||
| 2010 | 877 | 839 | 951 | 1,114 | 1,636 | 1,584 | 1,721 | 1,771 | 2,601 | 4,678 | 4,512 | 4,715 |
| 2011 | 4,341 | 4,241 | 5,068 | 5,369 | 4,349 | 4,622 | 4,752 | 4,486 | 4,022 | 4,669 | 4,454 | 4,401 |
| 2012 | 3,819 | 4,098 | 5,040 | 4,226 | 4,269 | 4,278 | 5,419 | 5,729 | 5,314 | 5,756 | 5,663 | 5,174 |
| 2013 | 4,577 | 4,656 | 5,425 | 5,575 | 5,170 | 4,705 | 5,118 | 4,883 | 4,811 | 5,619 | 5,076 | 5,207 |
| 2014 | 4,825 | 4,560 | 5,779 | 5,511 | 4,887 | 5,160 | 5,111 | 5,390 | 5,069 | 5,972 | 5,544 | 5,611 |
| 2015 | 5,207 | 5,247 | 5,621 | 5,545 | 5,372 | 5,349 | 5,401 | 5,380 | 5,376 | 6,301 | 5,282 | 5,640 |
| 2016 | 4,984 | 5,057 | 5,646 | 5,568 | 5,675 | 5,699 | 5,685 | 5,773 | 5,167 | 5,907 | 5,501 | 5,734 |
| 2017 | 4,946 | 4,733 | 5,575 | 5,706 | 5,747 | 5,616 | 5,860 | 5,755 | 5,215 | 5,752 | 5,408 | 5,532 |
| 2018 | 4,891 | 4,516 | 5,751 | 5,599 | 5,772 | 5,604 | 5,656 | 5,913 | 5,299 | 5,642 | 5,374 | 5,235 |
| 2019 | 4,976 | 4,820 | 5,470 | 5,541 | 5,335 | 5,825 | 5,942 | 6,371 | 5,593 | 5,796 | 5,422 | 5,452 |
| 2020 | 5,033 | 4,873 | 4,493 | 3,075 | 4,238 | 5,077 | 5,413 | 5,407 | 4,728 | 5,191 | 4,488 | 4,269 |
| 2021 | 4,192 | 4,060 | 5,136 | 5,483 | 5,745 | 5,611 | 5,906 | 5,590 | 5,242 | 5,365 | 4,991 | 5,137 |
| 2022 | 4,414 | 4,467 | 5,425 | 5,490 | 5,451 | 5,363 | 5,227 | 5,582 | 5,009 | 5,167 | 4,797 | 4,934 |
| 2023 | 4,516 | 4,328 | 4,926 | 4,935 | 5,444 | 5,317 | 5,515 | 5,614 | 5,157 | 5,243 | 5,061 | 4,870 |
| 2024 | 4,595 | |||||||||||
| - = No Data Reported; -- = Not Applicable; NA = Not Available; W = Withheld to avoid disclosure of individual company data. |
| Release Date: 3/29/2024 |
| Next Release Date: 4/30/2024 |