|
Download Data (XLS File) |
|
||||||||
|
||||||||
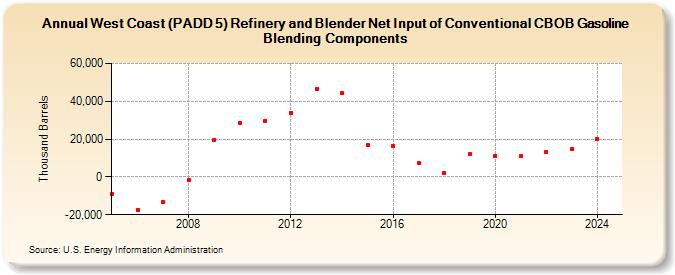
| West Coast (PADD 5) Refinery and Blender Net Input of Conventional CBOB Gasoline Blending Components (Thousand Barrels) | ||||||||
| Decade | Year-0 | Year-1 | Year-2 | Year-3 | Year-4 | Year-5 | Year-6 | Year-7 | Year-8 | Year-9 |
|---|---|---|---|---|---|---|---|---|---|---|
| 2000's | -8,885 | -17,284 | -13,277 | -1,883 | 19,739 | |||||
| 2010's | 28,552 | 29,720 | 34,009 | 46,702 | 44,159 | 16,823 | 16,485 | 7,387 | 2,007 | 11,991 |
| 2020's | 11,274 | 11,058 | 13,369 | 14,669 |
| - = No Data Reported; -- = Not Applicable; NA = Not Available; W = Withheld to avoid disclosure of individual company data. |
| Release Date: 8/30/2024 |
| Next Release Date: 8/29/2025 |