|
Download Data (XLS File) |
|
||||||||
|
||||||||
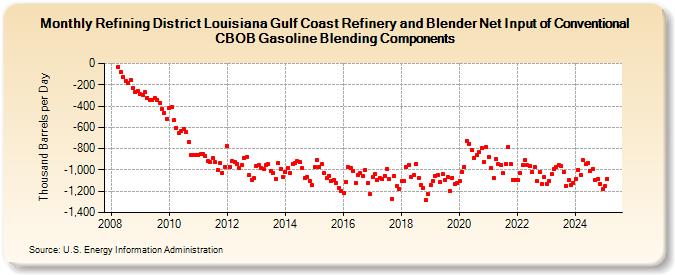
| Refining District Louisiana Gulf Coast Refinery and Blender Net Input of Conventional CBOB Gasoline Blending Components (Thousand Barrels per Day) | ||||||||
| Year | Jan | Feb | Mar | Apr | May | Jun | Jul | Aug | Sep | Oct | Nov | Dec |
|---|---|---|---|---|---|---|---|---|---|---|---|---|
| 2008 | -35 | -79 | -126 | -161 | -185 | -158 | -230 | -272 | -260 | |||
| 2009 | -288 | -299 | -272 | -321 | -347 | -343 | -323 | -340 | -370 | -423 | -464 | -519 |
| 2010 | -417 | -409 | -535 | -605 | -653 | -634 | -614 | -639 | -739 | -863 | -864 | -860 |
| 2011 | -855 | -849 | -850 | -873 | -920 | -928 | -889 | -929 | -1,000 | -939 | -1,028 | -969 |
| 2012 | -778 | -973 | -915 | -924 | -948 | -980 | -956 | -884 | -874 | -1,049 | -1,092 | -1,079 |
| 2013 | -966 | -958 | -977 | -994 | -953 | -946 | -1,013 | -1,024 | -1,081 | -930 | -987 | -1,064 |
| 2014 | -1,015 | -981 | -1,024 | -943 | -937 | -919 | -929 | -986 | -1,077 | -1,067 | -1,105 | -1,144 |
| 2015 | -973 | -904 | -975 | -948 | -1,026 | -1,079 | -1,053 | -1,102 | -1,093 | -1,123 | -1,170 | -1,194 |
| 2016 | -1,214 | -1,111 | -971 | -982 | -1,012 | -1,124 | -1,047 | -1,032 | -1,055 | -999 | -1,127 | -1,224 |
| 2017 | -1,070 | -1,040 | -1,096 | -1,078 | -1,089 | -1,052 | -988 | -1,085 | -1,272 | -1,057 | -1,155 | -1,179 |
| 2018 | -1,106 | -1,104 | -972 | -955 | -1,062 | -1,050 | -946 | -1,076 | -1,139 | -1,167 | -1,278 | -1,229 |
| 2019 | -1,143 | -1,105 | -1,052 | -1,049 | -1,114 | -1,042 | -1,090 | -1,066 | -1,200 | -1,073 | -1,133 | -1,125 |
| 2020 | -1,108 | -1,017 | -971 | -724 | -753 | -817 | -890 | -863 | -835 | -796 | -923 | -785 |
| 2021 | -879 | -980 | -1,073 | -900 | -947 | -955 | -1,033 | -943 | -781 | -942 | -1,091 | -1,092 |
| 2022 | -1,098 | -1,028 | -955 | -908 | -956 | -963 | -1,019 | -971 | -1,106 | -1,019 | -1,130 | -1,070 |
| 2023 | -1,129 | -1,103 | -1,036 | -987 | -972 | -958 | -967 | -1,015 | -1,147 | -1,095 | -1,144 | -1,118 |
| 2024 | -1,087 | -997 | -1,044 | -911 | -947 | -938 | ||||||
| - = No Data Reported; -- = Not Applicable; NA = Not Available; W = Withheld to avoid disclosure of individual company data. |
| Release Date: 8/30/2024 |
| Next Release Date: 9/30/2024 |