|
Download Data (XLS File) |
|
||||||||
|
||||||||
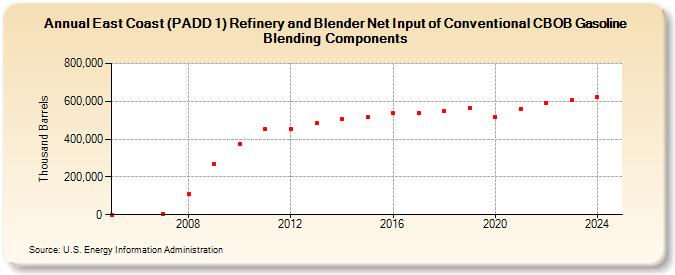
| East Coast (PADD 1) Refinery and Blender Net Input of Conventional CBOB Gasoline Blending Components (Thousand Barrels) | ||||||||
| Decade | Year-0 | Year-1 | Year-2 | Year-3 | Year-4 | Year-5 | Year-6 | Year-7 | Year-8 | Year-9 |
|---|---|---|---|---|---|---|---|---|---|---|
| 2000's | 68 | 4,150 | 110,005 | 267,499 | ||||||
| 2010's | 376,689 | 453,935 | 454,984 | 482,682 | 505,450 | 514,785 | 535,645 | 537,716 | 550,897 | 566,491 |
| 2020's | 518,616 | 561,545 | 593,265 | 603,286 |
| - = No Data Reported; -- = Not Applicable; NA = Not Available; W = Withheld to avoid disclosure of individual company data. |
| Release Date: 3/29/2024 |
| Next Release Date: 8/30/2024 |