|
Download Data (XLS File) |
|
||||||||
|
||||||||
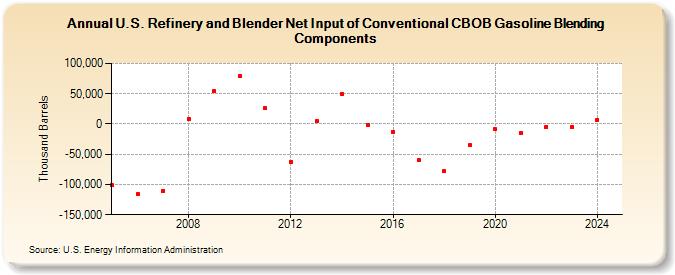
| U.S. Refinery and Blender Net Input of Conventional CBOB Gasoline Blending Components (Thousand Barrels) | ||||||||
| Decade | Year-0 | Year-1 | Year-2 | Year-3 | Year-4 | Year-5 | Year-6 | Year-7 | Year-8 | Year-9 |
|---|---|---|---|---|---|---|---|---|---|---|
| 2000's | -101,541 | -115,655 | -110,136 | 8,362 | 54,245 | |||||
| 2010's | 79,126 | 25,883 | -62,316 | 4,355 | 50,073 | -900 | -12,813 | -60,219 | -78,187 | -35,383 |
| 2020's | -8,311 | -15,318 | -4,206 | -5,713 |
| - = No Data Reported; -- = Not Applicable; NA = Not Available; W = Withheld to avoid disclosure of individual company data. |
| Release Date: 3/29/2024 |
| Next Release Date: 8/30/2024 |