|
Download Data (XLS File) |
|
||||||||
|
||||||||
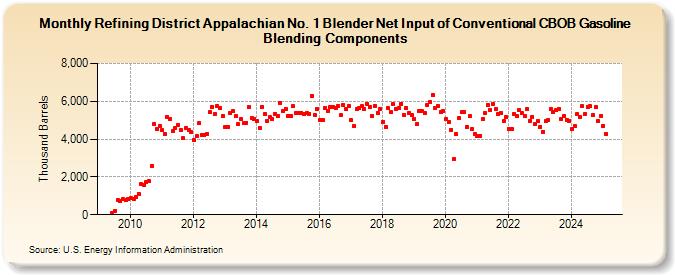
| Refining District Appalachian No. 1 Blender Net Input of Conventional CBOB Gasoline Blending Components (Thousand Barrels) | ||||||||
| Year | Jan | Feb | Mar | Apr | May | Jun | Jul | Aug | Sep | Oct | Nov | Dec |
|---|---|---|---|---|---|---|---|---|---|---|---|---|
| 2009 | 66 | 213 | 769 | 707 | 818 | 755 | 811 | |||||
| 2010 | 877 | 839 | 951 | 1,114 | 1,636 | 1,584 | 1,721 | 1,771 | 2,601 | 4,797 | 4,544 | 4,687 |
| 2011 | 4,466 | 4,254 | 5,168 | 5,068 | 4,406 | 4,604 | 4,747 | 4,472 | 4,038 | 4,595 | 4,473 | 4,385 |
| 2012 | 3,953 | 4,158 | 4,827 | 4,238 | 4,233 | 4,290 | 5,416 | 5,712 | 5,328 | 5,734 | 5,657 | 5,217 |
| 2013 | 4,627 | 4,666 | 5,379 | 5,469 | 5,202 | 4,792 | 5,038 | 4,839 | 4,878 | 5,703 | 5,122 | 5,074 |
| 2014 | 4,963 | 4,594 | 5,698 | 5,310 | 4,972 | 5,149 | 5,057 | 5,353 | 5,202 | 5,916 | 5,491 | 5,618 |
| 2015 | 5,211 | 5,221 | 5,725 | 5,388 | 5,384 | 5,399 | 5,346 | 5,386 | 5,347 | 6,293 | 5,287 | 5,589 |
| 2016 | 5,035 | 5,025 | 5,650 | 5,501 | 5,685 | 5,721 | 5,645 | 5,768 | 5,257 | 5,813 | 5,577 | 5,740 |
| 2017 | 4,996 | 4,698 | 5,584 | 5,627 | 5,733 | 5,587 | 5,864 | 5,709 | 5,233 | 5,770 | 5,390 | 5,610 |
| 2018 | 4,929 | 4,641 | 5,625 | 5,423 | 5,833 | 5,604 | 5,646 | 5,874 | 5,290 | 5,637 | 5,399 | 5,250 |
| 2019 | 5,051 | 4,786 | 5,466 | 5,460 | 5,357 | 5,801 | 5,953 | 6,339 | 5,652 | 5,753 | 5,424 | 5,492 |
| 2020 | 5,051 | 4,910 | 4,498 | 2,947 | 4,260 | 5,094 | 5,410 | 5,416 | 4,654 | 5,205 | 4,520 | 4,267 |
| 2021 | 4,160 | 4,184 | 5,045 | 5,403 | 5,830 | 5,531 | 5,862 | 5,572 | 5,307 | 5,363 | 4,970 | 5,165 |
| 2022 | 4,550 | 4,513 | 5,352 | 5,209 | 5,520 | 5,365 | 5,234 | 5,585 | 4,977 | 5,171 | 4,791 | 4,950 |
| 2023 | 4,570 | 4,324 | 4,857 | 4,922 | 5,477 | 5,307 | 5,516 | 5,591 | 5,170 | 5,247 | 5,035 | 4,980 |
| 2024 | 4,531 | 4,690 | 5,312 | 5,195 | ||||||||
| - = No Data Reported; -- = Not Applicable; NA = Not Available; W = Withheld to avoid disclosure of individual company data. |
| Release Date: 6/28/2024 |
| Next Release Date: 7/31/2024 |