|
Download Data (XLS File) |
|
||||||||
|
||||||||
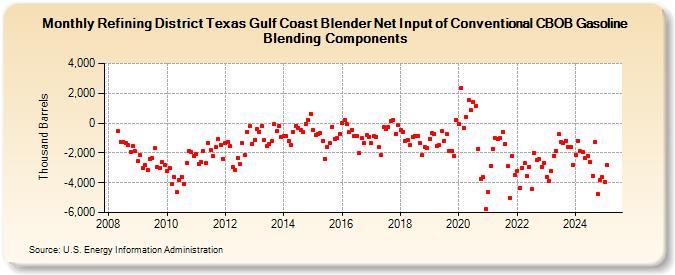
| Refining District Texas Gulf Coast Blender Net Input of Conventional CBOB Gasoline Blending Components (Thousand Barrels) | ||||||||
| Year | Jan | Feb | Mar | Apr | May | Jun | Jul | Aug | Sep | Oct | Nov | Dec |
|---|---|---|---|---|---|---|---|---|---|---|---|---|
| 2008 | -552 | -1,257 | -1,264 | -1,331 | -1,469 | -1,910 | -1,521 | -1,896 | ||||
| 2009 | -2,561 | -2,167 | -3,037 | -2,805 | -3,132 | -2,382 | -2,356 | -1,695 | -2,945 | -3,002 | -2,637 | -2,782 |
| 2010 | -3,229 | -2,996 | -4,099 | -3,648 | -4,634 | -3,848 | -3,589 | -4,105 | -2,654 | -1,845 | -1,949 | -2,232 |
| 2011 | -2,056 | -2,718 | -2,593 | -1,882 | -2,706 | -1,357 | -1,788 | -2,207 | -1,634 | -1,073 | -1,444 | -2,382 |
| 2012 | -1,355 | -1,270 | -1,555 | -2,976 | -3,122 | -2,339 | -2,767 | -1,352 | -2,170 | -610 | -211 | -1,398 |
| 2013 | -1,152 | -379 | -564 | -225 | -1,132 | -1,539 | -1,420 | -1,233 | -88 | -560 | -209 | -914 |
| 2014 | -884 | -882 | -1,177 | -1,443 | -594 | -167 | -344 | -488 | -568 | -46 | 201 | 639 |
| 2015 | -462 | -826 | -744 | -654 | -1,177 | -2,419 | -1,583 | -1,347 | -238 | -1,095 | -1,001 | -719 |
| 2016 | 33 | 220 | -83 | -570 | -445 | -860 | -852 | -1,989 | -1,019 | -1,329 | -796 | -900 |
| 2017 | -1,306 | -886 | -925 | -1,603 | -2,139 | -292 | -397 | -276 | 119 | 232 | -737 | -112 |
| 2018 | -468 | -610 | -1,216 | -1,153 | -1,475 | -930 | -846 | -878 | -1,348 | -2,168 | -1,605 | -1,679 |
| 2019 | -1,046 | -689 | -706 | -1,524 | -1,488 | -537 | -1,233 | -701 | -1,852 | -1,870 | -2,224 | 228 |
| 2020 | -27 | 2,354 | -323 | 414 | 1,527 | 859 | 1,447 | 1,119 | -1,753 | -3,728 | -3,622 | -5,785 |
| 2021 | -4,647 | -2,872 | -1,709 | -1,006 | -1,051 | -989 | -609 | -1,409 | -2,896 | -4,991 | -2,220 | -3,499 |
| 2022 | -3,189 | -4,324 | -2,997 | -2,707 | -3,516 | -2,925 | -4,423 | -1,976 | -2,501 | -2,408 | -2,928 | -2,653 |
| 2023 | -3,614 | -3,904 | -3,245 | -2,188 | -1,884 | -754 | -1,298 | -1,303 | -1,199 | -1,612 | -1,632 | -2,799 |
| 2024 | -2,131 | -1,180 | -1,898 | -1,944 | ||||||||
| - = No Data Reported; -- = Not Applicable; NA = Not Available; W = Withheld to avoid disclosure of individual company data. |
| Release Date: 6/28/2024 |
| Next Release Date: 7/31/2024 |