|
Download Data (XLS File) |
|
||||||||
|
||||||||
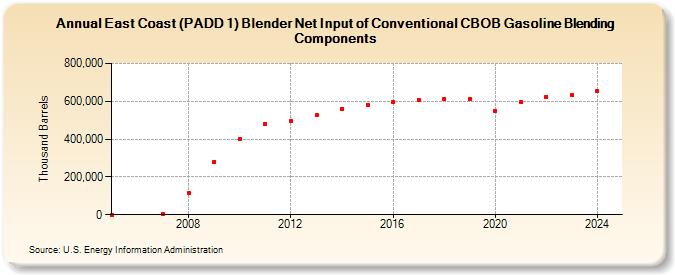
| East Coast (PADD 1) Blender Net Input of Conventional CBOB Gasoline Blending Components (Thousand Barrels) | ||||||||
| Decade | Year-0 | Year-1 | Year-2 | Year-3 | Year-4 | Year-5 | Year-6 | Year-7 | Year-8 | Year-9 |
|---|---|---|---|---|---|---|---|---|---|---|
| 2000's | 68 | 4,150 | 115,980 | 280,480 | ||||||
| 2010's | 399,969 | 480,870 | 495,460 | 529,160 | 561,111 | 581,161 | 597,202 | 605,768 | 612,593 | 614,580 |
| 2020's | 550,788 | 594,577 | 624,977 | 634,024 |
| - = No Data Reported; -- = Not Applicable; NA = Not Available; W = Withheld to avoid disclosure of individual company data. |
| Release Date: 3/29/2024 |
| Next Release Date: 8/30/2024 |