|
Download Data (XLS File) |
|
||||||||
|
||||||||
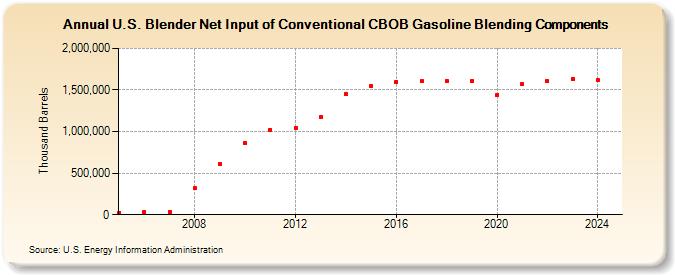
| U.S. Blender Net Input of Conventional CBOB Gasoline Blending Components (Thousand Barrels) | ||||||||
| Decade | Year-0 | Year-1 | Year-2 | Year-3 | Year-4 | Year-5 | Year-6 | Year-7 | Year-8 | Year-9 |
|---|---|---|---|---|---|---|---|---|---|---|
| 2000's | 25,455 | 31,439 | 37,744 | 318,072 | 607,397 | |||||
| 2010's | 865,763 | 1,022,531 | 1,043,794 | 1,172,433 | 1,453,247 | 1,544,243 | 1,599,092 | 1,609,309 | 1,611,993 | 1,613,775 |
| 2020's | 1,439,405 | 1,566,821 | 1,603,179 | 1,627,684 |
| - = No Data Reported; -- = Not Applicable; NA = Not Available; W = Withheld to avoid disclosure of individual company data. |
| Release Date: 3/29/2024 |
| Next Release Date: 8/30/2024 |